Поделиться
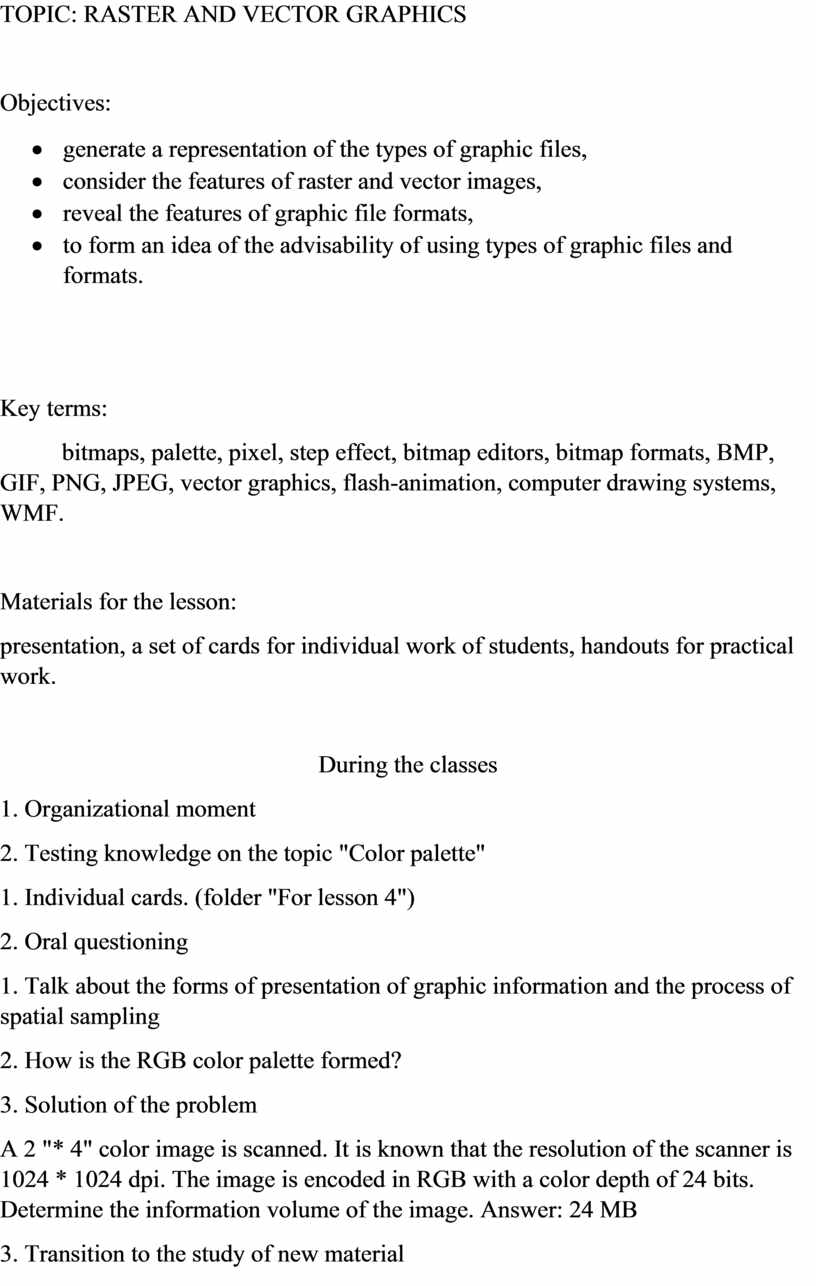
TOPIC: RASTER AND VECTOR GRAPHICS
Objectives:
· generate a representation of the types of graphic files,
· consider the features of raster and vector images,
· reveal the features of graphic file formats,
· to form an idea of the advisability of using types of graphic files and formats.
Key terms:
bitmaps, palette, pixel, step effect, bitmap editors, bitmap formats, BMP, GIF, PNG, JPEG, vector graphics, flash-animation, computer drawing systems, WMF.
Materials for the lesson:
presentation, a set of cards for individual work of students, handouts for practical work.
During the classes
1. Organizational moment
2. Testing knowledge on the topic "Color palette"
1. Individual cards. (folder "For lesson 4")
2. Oral questioning
1. Talk about the forms of presentation of graphic information and the process of spatial sampling
2. How is the RGB color palette formed?
3. Solution of the problem
A 2 "* 4" color image is scanned. It is known that the resolution of the scanner is 1024 * 1024 dpi. The image is encoded in RGB with a color depth of 24 bits. Determine the information volume of the image. Answer: 24 MB
3. Transition to the study of new material
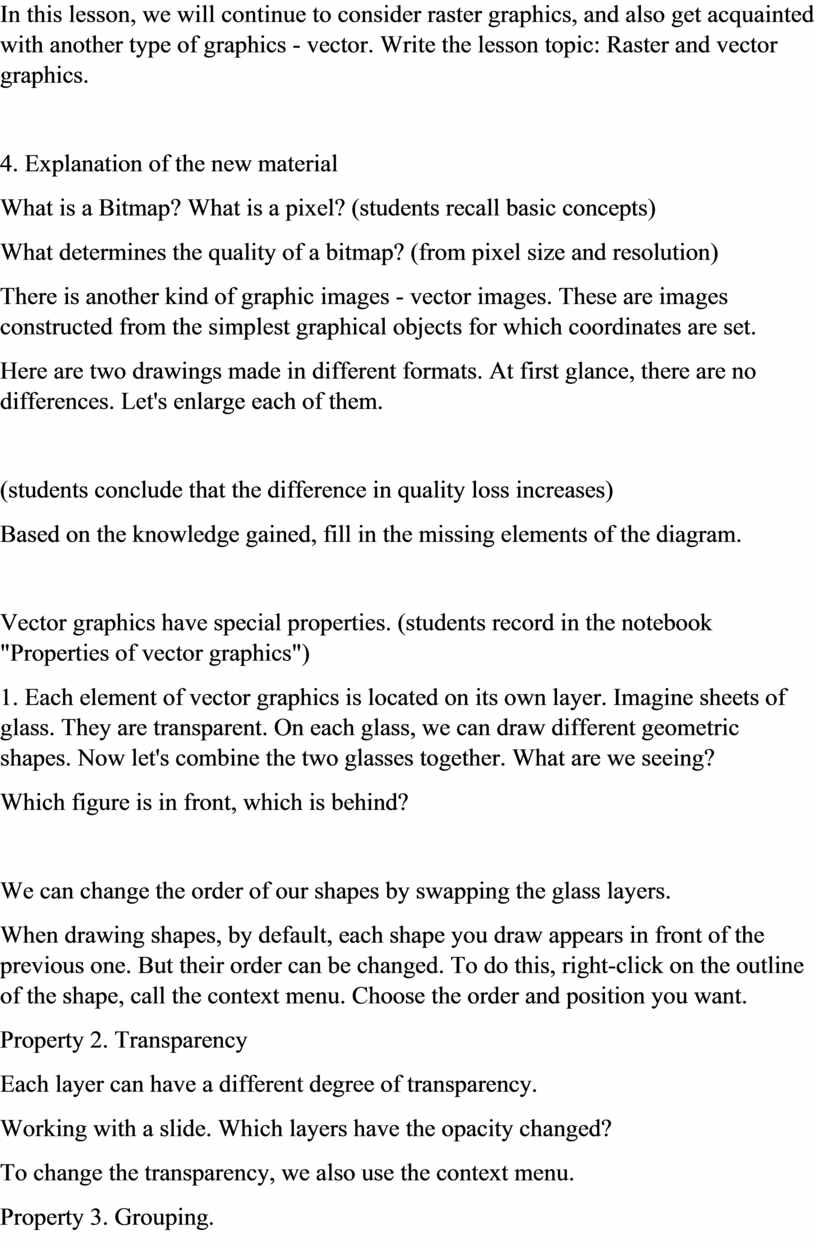
In this lesson, we will continue to consider raster graphics, and also get acquainted with another type of graphics - vector. Write the lesson topic: Raster and vector graphics.
4. Explanation of the new material
What is a Bitmap? What is a pixel? (students recall basic concepts)
What determines the quality of a bitmap? (from pixel size and resolution)
There is another kind of graphic images - vector images. These are images constructed from the simplest graphical objects for which coordinates are set.
Here are two drawings made in different formats. At first glance, there are no differences. Let's enlarge each of them.
(students conclude that the difference in quality loss increases)
Based on the knowledge gained, fill in the missing elements of the diagram.
Vector graphics have special properties. (students record in the notebook "Properties of vector graphics")
1. Each element of vector graphics is located on its own layer. Imagine sheets of glass. They are transparent. On each glass, we can draw different geometric shapes. Now let's combine the two glasses together. What are we seeing?
Which figure is in front, which is behind?
We can change the order of our shapes by swapping the glass layers.
When drawing shapes, by default, each shape you draw appears in front of the previous one. But their order can be changed. To do this, right-click on the outline of the shape, call the context menu. Choose the order and position you want.
Property 2. Transparency
Each layer can have a different degree of transparency.
Working with a slide. Which layers have the opacity changed?
To change the transparency, we also use the context menu.
Property 3. Grouping.
Graphic primitives can be grouped. For example, a group of three objects. They are grouped. What operations can you do with grouped objects?
(copy, rotate, change color, resize object)
You can ungroup grouped objects.
For example, Word has a collection of pictures. These drawings refer to vector graphics. They are composed of graphical primitives. They can be ungrouped. See example on the slide.
Different types of editors are used for different types of computer graphics. Try to define what a graphic editor is according to the scheme: graphic editor - what is it, what is it for. In this case, the necessary terms and words are given below. Find the ones you think you need and make a proposal from them.
A graphics editor is a program for creating, editing and viewing graphic images.
Make a diagram of "Graphic file extensions" in a notebook. Two arrows to the sides. Under the first write "raster", under the second "vector". Leave room for filling. You will do this work at home based on the text.
4. Practical work.
Creation and saving of raster images.
1. Open the graphic editor.
2. Create 8 rectangles on one sheet.
3. Using the data table. 1.3 page 17, fill 8 rectangles with different colors, indicating the intensity of the base colors of the RGB palette using counters.
4. Save the resulting image in BMP, GIF, PNG, JPEG format (you must save the files in your own folder)
5. Write down in a notebook the volumes of files saved in different formats. Determine the largest and smallest bitmap volume.
Материалы на данной страницы взяты из открытых источников либо размещены пользователем в соответствии с договором-офертой сайта. Вы можете сообщить о нарушении.