Поделиться

Theoretical material for the lesson, definitions for concepts
When an ideal gas is compressed adiabatically (Q=0), work is done on it and its temperature increases; in an adiabatic expansion, the gas does work and its temperature drops. Adiabatic compressions actually occur in the cylinders of a car, where the compressions of the gas-air mixture take place so quickly that there is no time for the mixture to exchange heat with its environment. Nevertheless, because work is done on the mixture during the compression, its temperature does rise significantly. In fact, the temperature increases can be so large that the mixture can explode without the addition of a spark. Such explosions, since they are not timed, make a car run poorly—it usually “knocks.” Because ignition temperature rises with the octane of gasoline, one way to overcome this problem is to use a higher-octane gasoline.
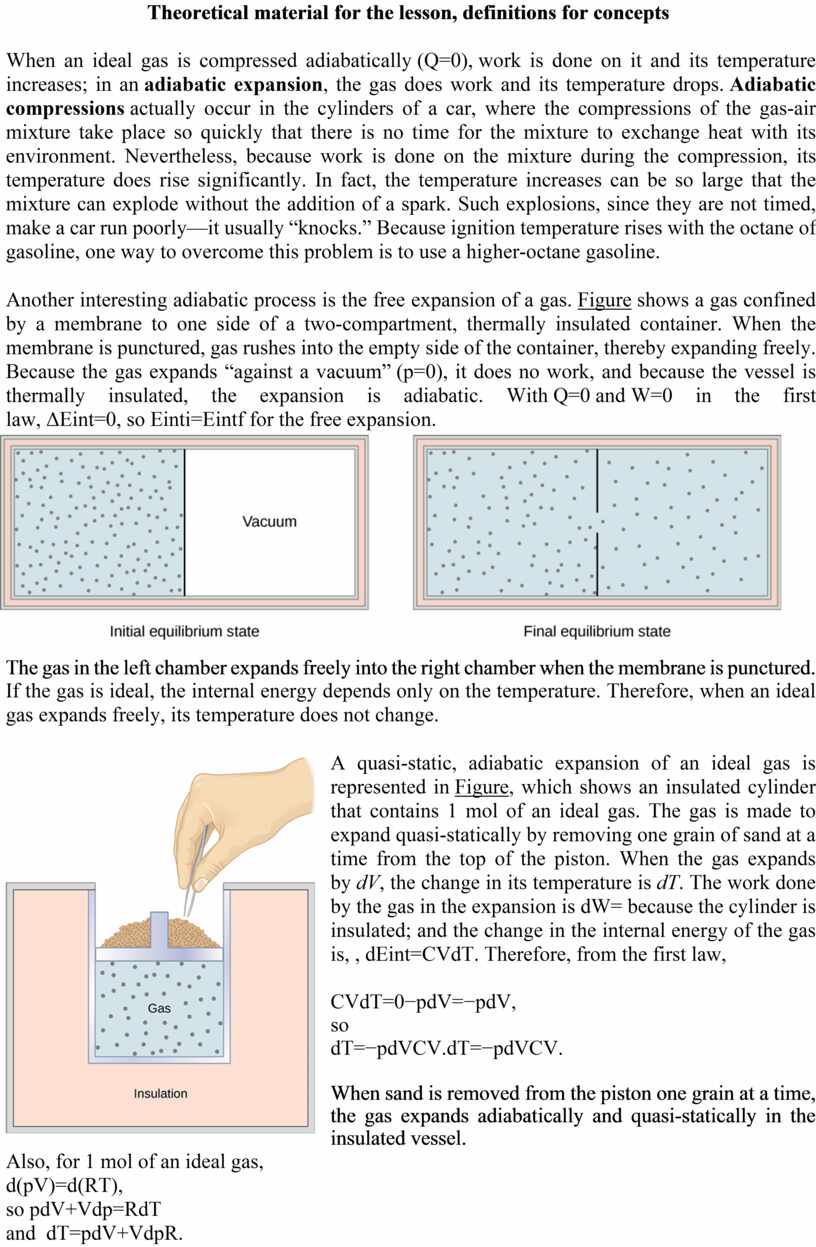
Another interesting adiabatic process is the free expansion of a gas. Figure shows a gas confined by a membrane to one side of a two-compartment, thermally insulated container. When the membrane is punctured, gas rushes into the empty side of the container, thereby expanding freely. Because the gas expands “against a vacuum” (p=0), it does no work, and because the vessel is thermally insulated, the expansion is adiabatic. With Q=0 and W=0 in the first law, ΔEint=0, so Einti=Eintf for the free expansion.
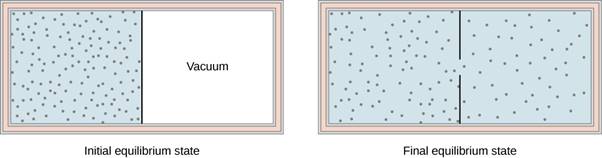
The gas in the left chamber expands freely into the right chamber when the membrane is punctured.
If the gas is ideal, the internal energy depends only on the temperature. Therefore, when an ideal gas expands freely, its temperature does not change.
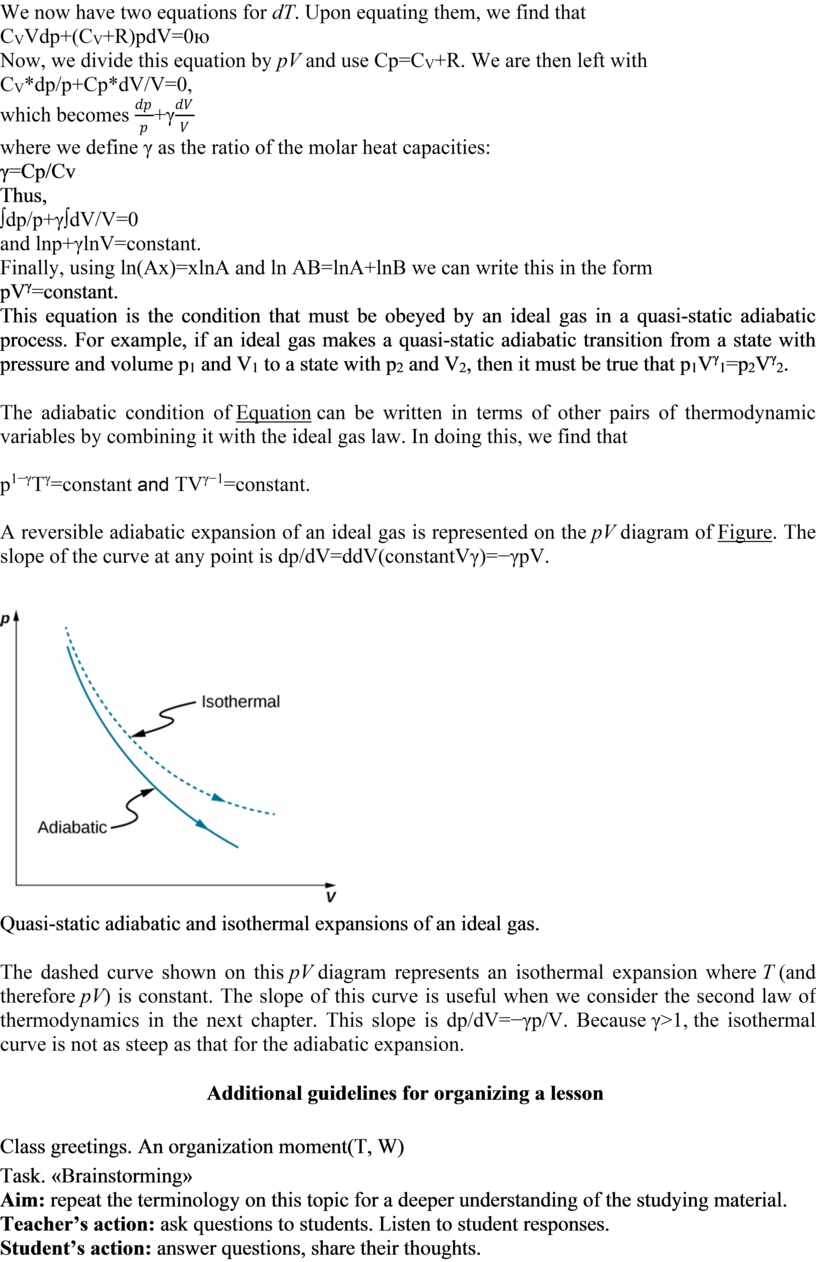
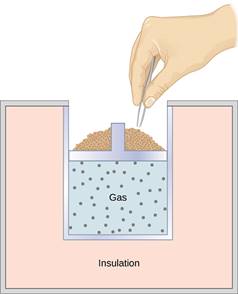 A quasi-static, adiabatic expansion of an ideal gas is represented
in Figure, which
shows an insulated cylinder that contains 1 mol of an ideal gas. The gas is
made to expand quasi-statically by removing one grain of sand at a time from
the top of the piston. When the gas expands by dV, the change in
its temperature is dT. The work done by the gas in the expansion
is dW=
because the cylinder is insulated; and the change in the internal energy of the
gas is, , dEint=CVdT. Therefore, from the first law,
A quasi-static, adiabatic expansion of an ideal gas is represented
in Figure, which
shows an insulated cylinder that contains 1 mol of an ideal gas. The gas is
made to expand quasi-statically by removing one grain of sand at a time from
the top of the piston. When the gas expands by dV, the change in
its temperature is dT. The work done by the gas in the expansion
is dW=
because the cylinder is insulated; and the change in the internal energy of the
gas is, , dEint=CVdT. Therefore, from the first law,
CVdT=0−pdV=−pdV,
so
dT=−pdVCV.dT=−pdVCV.
When sand is removed from the piston one grain at a time, the gas expands adiabatically and quasi-statically in the insulated vessel.
Also, for 1 mol of an ideal gas,
d(pV)=d(RT),
so pdV+Vdp=RdT
and dT=pdV+VdpR.
We now have two equations for dT. Upon equating them, we find that
CVVdp+(CV+R)pdV=0ю
Now, we divide this equation by pV and use Cp=CV+R. We are then left with
CV*dp/p+Cp*dV/V=0,
which becomes ![]() +γ
+γ![]()
where we define γ as the ratio of the molar heat capacities:
γ=Cp/Cv
Thus,
∫dp/p+γ∫dV/V=0
аnd lnp+γlnV=constant.
Finally, using ln(Ax)=xlnA and ln AB=lnA+lnB we can write this in the form
pVγ=constant.
This equation is the condition that must be obeyed by an ideal gas in a quasi-static adiabatic process. For example, if an ideal gas makes a quasi-static adiabatic transition from a state with pressure and volume p1 and V1 to a state with p2 and V2, then it must be true that p1Vγ1=p2Vγ2.
The adiabatic condition of Equation can be written in terms of other pairs of thermodynamic variables by combining it with the ideal gas law. In doing this, we find that
p1−γTγ=constant and TVγ−1=constant.
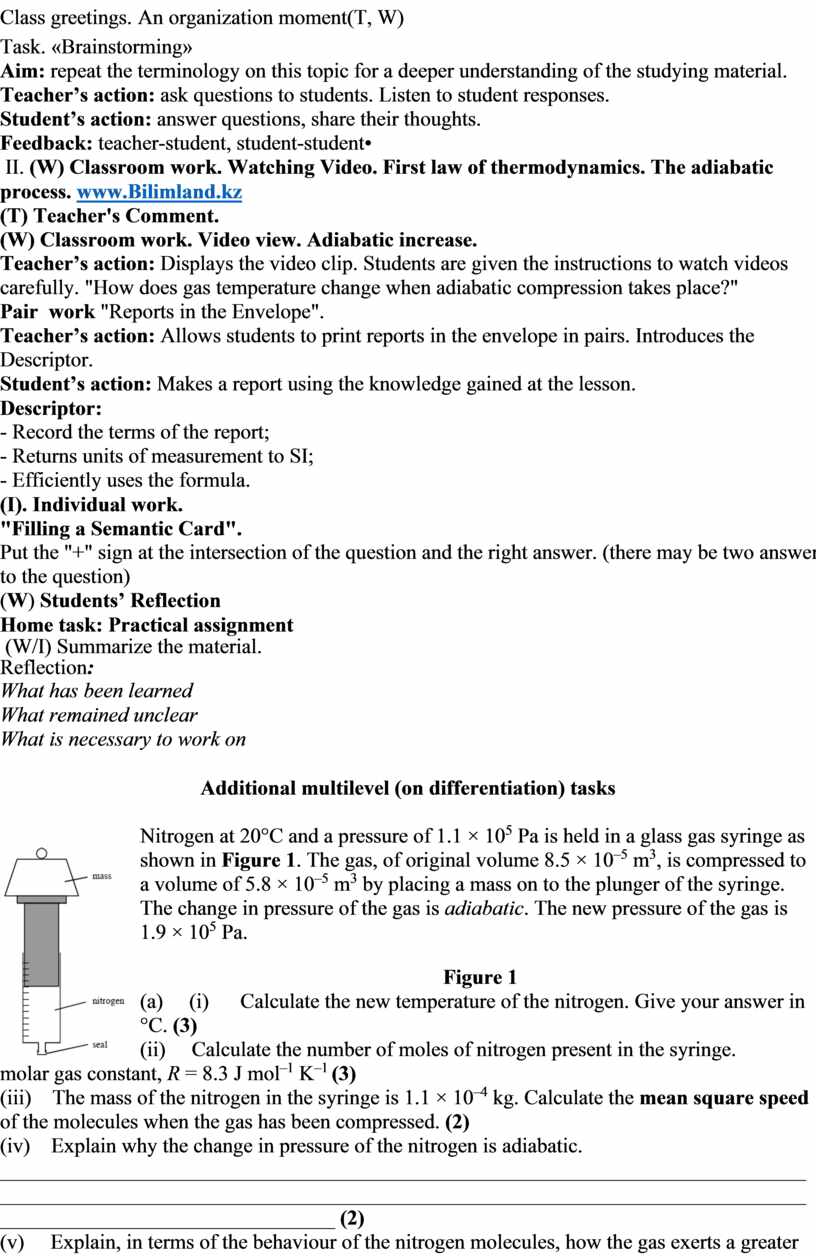
A reversible adiabatic expansion of an ideal gas is represented on the pV diagram of Figure. The slope of the curve at any point is dp/dV=ddV(constantVγ)=−γpV.
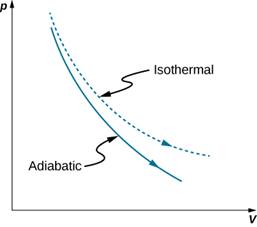 |
Quasi-static adiabatic and isothermal expansions of an ideal gas.
The dashed curve shown on this pV diagram represents an isothermal expansion where T (and therefore pV) is constant. The slope of this curve is useful when we consider the second law of thermodynamics in the next chapter. This slope is dp/dV=−γp/V. Because γ>1, the isothermal curve is not as steep as that for the adiabatic expansion.
Additional guidelines for organizing a lesson
|
Class greetings. An organization moment(T, W) Task. «Brainstorming» Aim: repeat the terminology on this topic for a deeper understanding of the studying material. Teacher’s action: ask questions to students. Listen to student responses. Student’s action: answer questions, share their thoughts. Feedback: teacher-student, student-student• |
|
II. (W) Classroom work. Watching Video. First law of thermodynamics. The adiabatic process. www.Bilimland.kz (T) Teacher's Comment. (W) Classroom work. Video view. Adiabatic increase. Teacher’s action: Displays the video clip. Students are given the instructions to watch videos carefully. "How does gas temperature change when adiabatic compression takes place?" Pair work "Reports in the Envelope". Teacher’s action: Allows students to print reports in the envelope in pairs. Introduces the Descriptor. Student’s action: Makes a report using the knowledge gained at the lesson. Descriptor: - Record the terms of the report; - Returns units of measurement to SI; - Efficiently uses the formula. (I). Individual work. "Filling a Semantic Card". Put the "+" sign at the intersection of the question and the right answer. (there may be two answers to the question) |
|
(W) Students’ Reflection Home task: Practical assignment (W/I) Summarize the material. Reflection: - What has been learned - What remained unclear - What is necessary to work on |
Additional multilevel (on differentiation) tasks
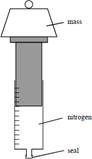 Nitrogen
at 20°C and a pressure of 1.1 × 10⁵ Pa is held in a glass gas
syringe as shown in Figure 1. The gas, of original volume 8.5 × 10⁻⁵
m3, is compressed to a volume of 5.8 × 10⁻⁵ m3
by placing a mass on to the plunger of the syringe. The change in pressure of
the gas is adiabatic. The new pressure of the gas is 1.9 × 10⁵
Pa.
Nitrogen
at 20°C and a pressure of 1.1 × 10⁵ Pa is held in a glass gas
syringe as shown in Figure 1. The gas, of original volume 8.5 × 10⁻⁵
m3, is compressed to a volume of 5.8 × 10⁻⁵ m3
by placing a mass on to the plunger of the syringe. The change in pressure of
the gas is adiabatic. The new pressure of the gas is 1.9 × 10⁵
Pa.
Figure 1
(a) (i) Calculate the new temperature of the nitrogen. Give your answer in °C. (3)
(ii) Calculate the number of moles of nitrogen present in the syringe.
molar gas constant, R = 8.3 J mol–1 K–1 (3)
(iii) The mass of the nitrogen in the syringe is 1.1 × 10⁻⁴ kg. Calculate the mean square speed of the molecules when the gas has been compressed. (2)
(iv) Explain why the change in pressure of the nitrogen is adiabatic. __________________________________________________________________________________________________________________________________________________________________________________________ (2)
(v) Explain, in terms of the behaviour of the nitrogen molecules, how the gas exerts a greater pressure than it did before it was compressed.
____________________________________________________________________________________________________________________________________________________________________________________________________________________________________________________________________________________________________________________________________________________________________________________ (3)
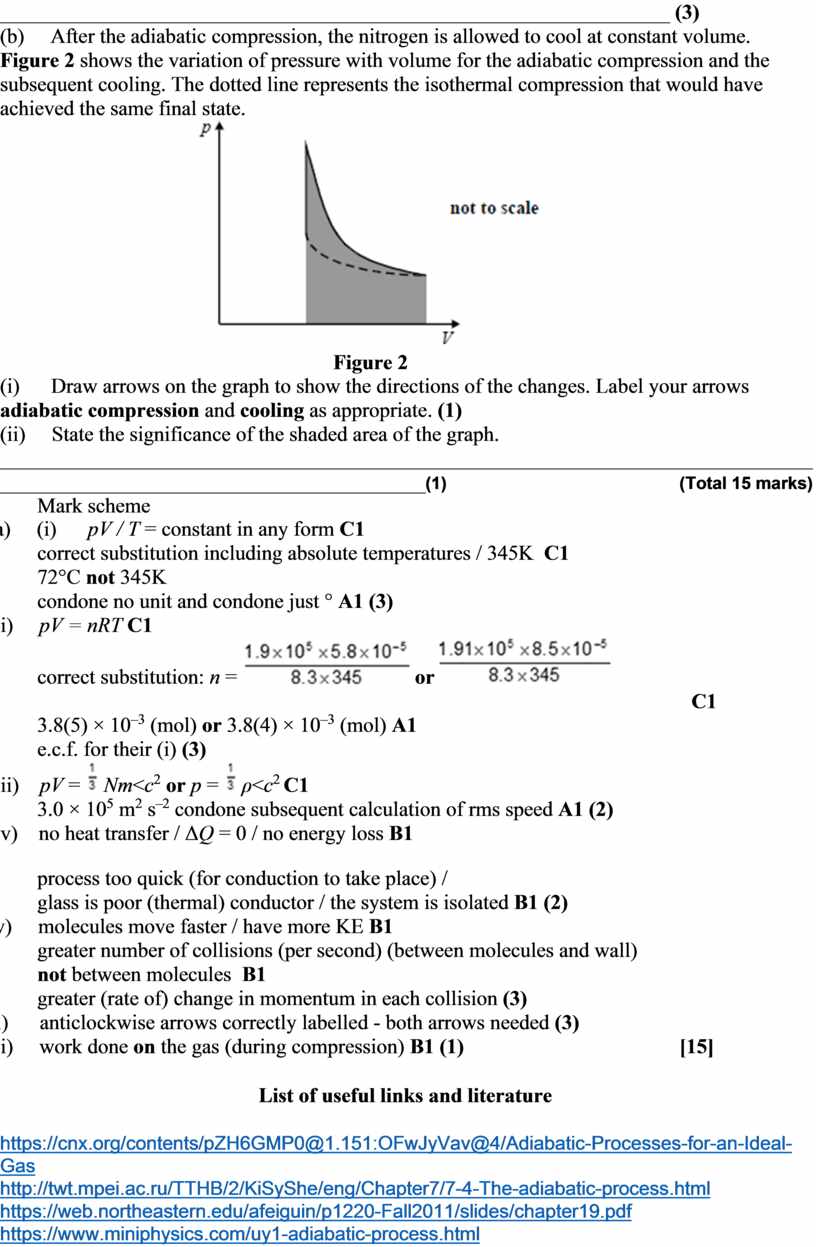
(b) After the adiabatic compression, the nitrogen is allowed to cool at constant volume. Figure 2 shows the variation of pressure with volume for the adiabatic compression and the subsequent cooling. The dotted line represents the isothermal compression that would have achieved the same final state.
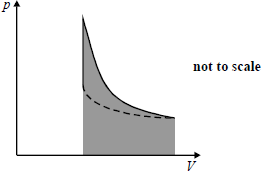
Figure 2
(i) Draw arrows on the graph to show the directions of the changes. Label your arrows adiabatic compression and cooling as appropriate. (1)
(ii) State the significance of the shaded area of the graph.
___________________________________________________________________________________________________________________________(1) (Total 15 marks)
Mark scheme
(a) (i) pV / T = constant in any form C1
correct substitution including absolute temperatures / 345K C1
72°C
not 345K
condone no unit and condone just ° A1 (3)
(ii) pV = nRT C1
correct
substitution: n = ![]() or
or ![]()
C1
3.8(5) × 10–3 (mol) or 3.8(4) × 10–3 (mol) A1
e.c.f. for their (i) (3)
(iii) pV
= ![]() Nm<c2 or p
=
Nm<c2 or p
= ![]() ρ<c2 C1
ρ<c2 C1
3.0 × 10⁵ m2 s–2 condone subsequent calculation of rms speed A1 (2)
(iv) no heat transfer / ΔQ = 0 / no energy loss B1
process
too quick (for conduction to take place) /
glass is poor (thermal) conductor / the system is isolated B1 (2)
(v) molecules move faster / have more KE B1
greater
number of collisions (per second) (between molecules and wall)
not between molecules B1
greater (rate of) change in momentum in each collision (3)
(b) (i) anticlockwise arrows correctly labelled - both arrows needed (3)
(ii) work done on the gas (during compression) B1 (1) [15]
List of useful links and literature
https://cnx.org/contents/pZH6GMP0@1.151:OFwJyVav@4/Adiabatic-Processes-for-an-Ideal-Gas
http://twt.mpei.ac.ru/TTHB/2/KiSyShe/eng/Chapter7/7-4-The-adiabatic-process.html
https://web.northeastern.edu/afeiguin/p1220-Fall2011/slides/chapter19.pdf
https://www.miniphysics.com/uy1-adiabatic-process.html
Скачано с www.znanio.ru
Материалы на данной страницы взяты из открытых источников либо размещены пользователем в соответствии с договором-офертой сайта. Вы можете сообщить о нарушении.