Поделиться

Investigation sheet
1. a) i) State Boyle’s Law.
…………………………………………………………………………………………………………………………………………………………………………………………………………
……………………………………………………………………………………………………………………………………………………………………….…………………………….. [1]
ii) Seal the open end of the syringe with your finger and press the plunger. Then, with your finger still sealing the syringe, try to push the air out of the syringe.
Based on what you feel on your finger, describe what happens to the pressure inside the syringe as you pull and push the plunger. Relate your answer with the changes in volume of the air inside the syringe.
…………………………………………………………………………………………………………………………………………………………………………………………………………
……………………………………………………………………………………………………
……………………………………………………………………………………………………………………………………………………………………….…………………………….. [2]
iii) State the uncertainty of the syringe that you will use for this experiment: ………………………………………………………………………………… [1]
b) Draw a table in the space below and use it to record your results for part (b).
[3]
Setup
– Prepare the material and check if all devices are working.
Experimental procedure (adapted from Pasco supporting documents)
1. Start a new experiment on the data collection system.
2. Select “digits” that will allow you to read the instantaneous pressure.
Note: Enter "Absolute pressure" with the units of "kPa"
3. Use the sensor extension cable to connect an absolute pressure sensor to the data collection system.
Note: The syringe should not yet be connected to the sensor.
5. Move the plunger of the syringe to the 30 mL mark (adapt all the volumes if you have a different syringe)
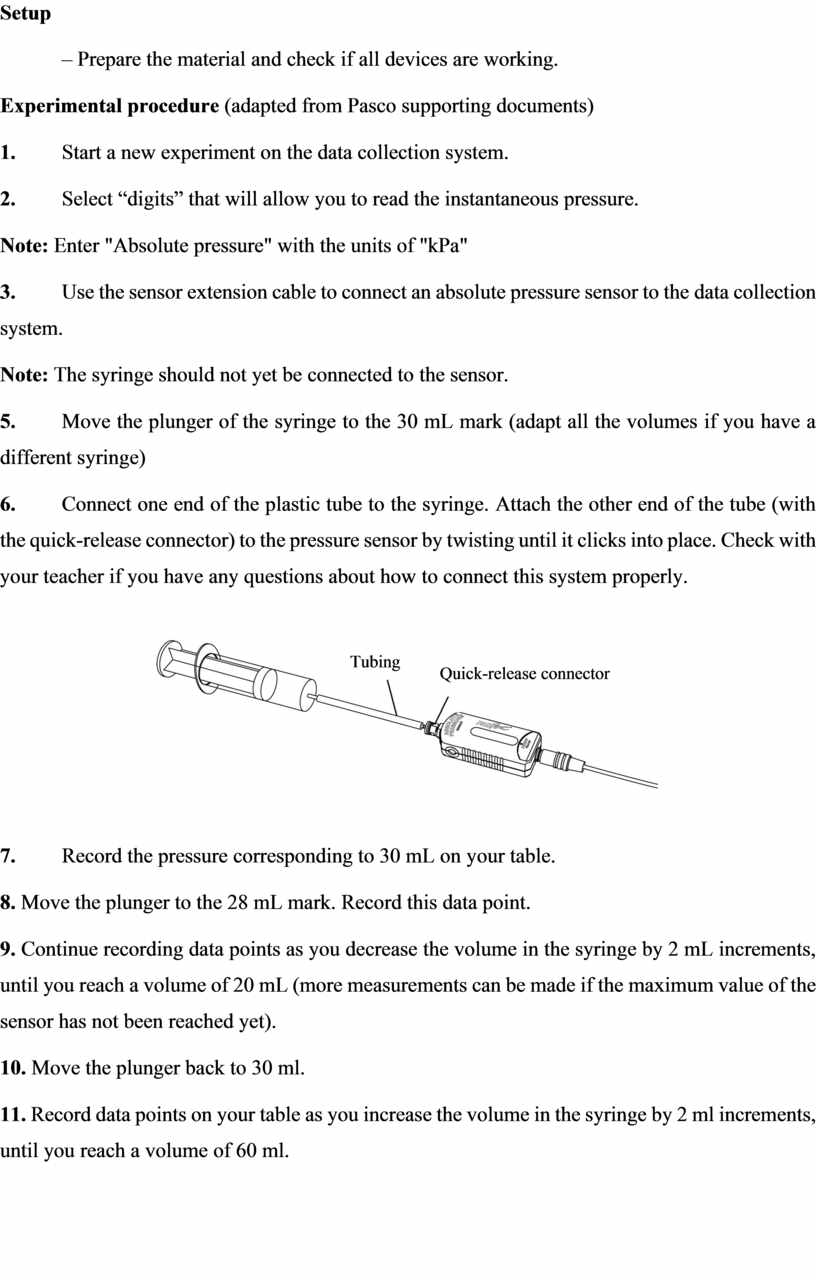
6. Connect one end of the plastic tube to the syringe. Attach the other end of the tube (with the quick-release connector) to the pressure sensor by twisting until it clicks into place. Check with your teacher if you have any questions about how to connect this system properly.
 |
7. Record the pressure corresponding to 30 mL on your table.
8. Move the plunger to the 28 mL mark. Record this data point.
9. Continue recording data points as you decrease the volume in the syringe by 2 mL increments, until you reach a volume of 20 mL (more measurements can be made if the maximum value of the sensor has not been reached yet).
10. Move the plunger back to 30 ml.
11. Record data points on your table as you increase the volume in the syringe by 2 ml increments, until you reach a volume of 60 ml.
c) Use your results to plot a graph of pressure p on the y-axis against volume V on the x-axis.

[3]
d) Draw the line of best fit and suggest a mathematical relationship between pressure and volume.
Are your results in agreement with your statement of Boyle’s law?
…………………………………………………………………………………………………………………………………………………………………………………………………………
……………………………………………………………………………………………………
……………………………………………………………………………………………………………………………………………………………………….…………………………….. [3]
e) a) Describe two sources of uncertainty or limitations of the procedure for this experiment.
1. …………………………………………………………………………………………………………………………………………………………………………………………………………
……………………………………………………………………………………………………
……………………………………………………………………………………………………………………………………………………………………….…………………………….. [1]
2. …………………………………………………………………………………………………………………………………………………………………………………………………………
……………………………………………………………………………………………………
……………………………………………………………………………………………………………………………………………………………………….…………………………….. [1]
f) Consider the plot p vs Vm. If you wanted to get a straight-line graph in this experiment as we usually do, which value of m will allow for this?
m = ……… [1]
g) Why is it important to use a short tube to connect the syringe to the sensor?
…………………………………………………………………………………………………………………………………………………………………………………………………………
……………………………………………………………………………………………………
……………………………………………………………………………………………………………………………………………………………………….…………………………….. [2]
h) Describe two improvements that could be made to this experiment. You may suggest the use of other apparatus or different procedures.
1. …………………………………………………………………………………………………………………………………………………………………………………………………………
……………………………………………………………………………………………………
……………………………………………………………………………………………………………………………………………………………………….…………………………….. [1]
2. …………………………………………………………………………………………………………………………………………………………………………………………………………
……………………………………………………………………………………………………
……………………………………………………………………………………………………………………………………………………………………….…………………………….. [1]
[Total: 20]
Материалы на данной страницы взяты из открытых источников либо размещены пользователем в соответствии с договором-офертой сайта. Вы можете сообщить о нарушении.