Поделиться

Participant’s ID number
|
|
|
|
|
|
|
WRITING
Time: 20 minutes
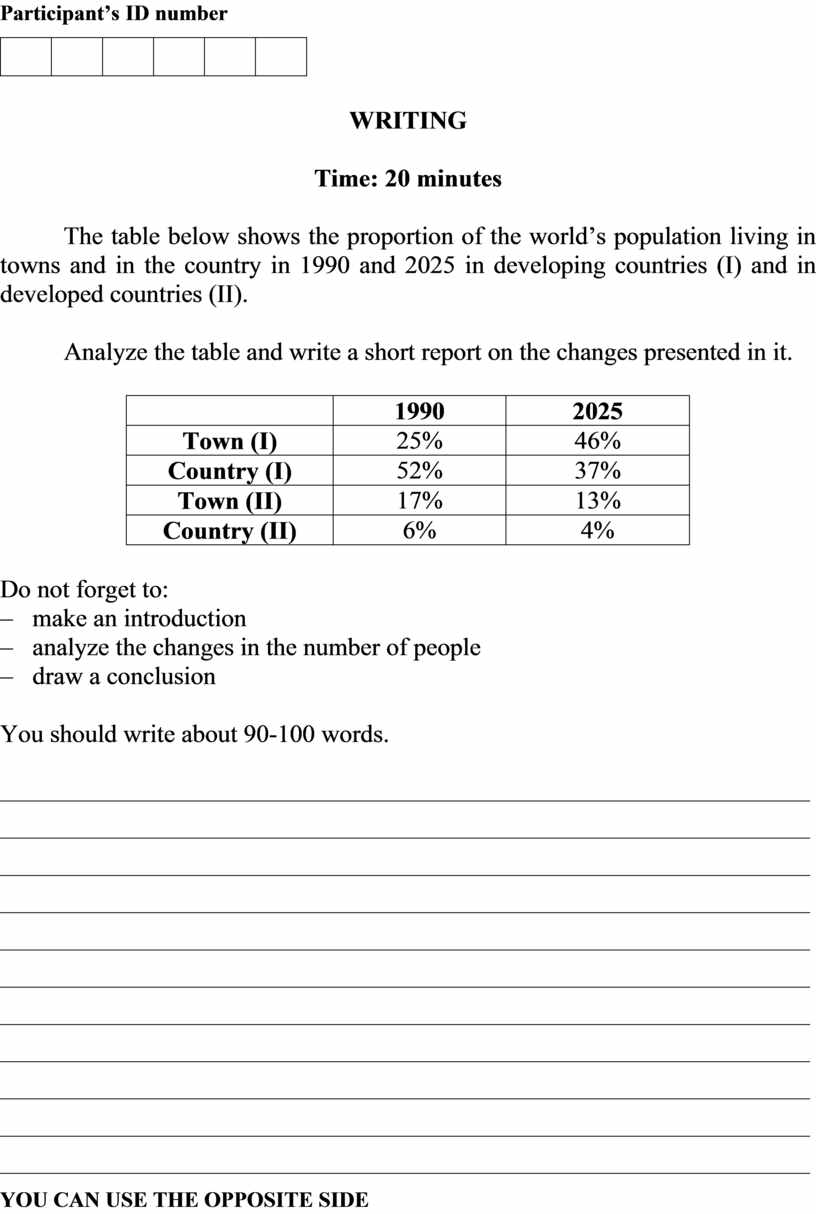
The table below shows the proportion of the world’s population living in towns and in the country in 1990 and 2025 in developing countries (I) and in developed countries (II).
Analyze the table and write a short report on the changes presented in it.
|
|
1990 |
2025 |
|
Town (I) |
25% |
46% |
|
Country (I) |
52% |
37% |
|
Town (II) |
17% |
13% |
|
Country (II) |
6% |
4% |
Do not forget to:
– make an introduction
– analyze the changes in the number of people
– draw a conclusion
You should write about 90-100 words.
_________________________________________________________________________________________________________________________________________________________________________________________________________________________________________________________________________________________________________________________________________________________________________________________________________________________________________________________________________________________________________________________________________________________________________________________________________________________________________________________________________________________________________________________________________________________________________________________________________________________________________________________
YOU CAN USE THE OPPOSITE SIDE
Материалы на данной страницы взяты из открытых источников либо размещены пользователем в соответствии с договором-офертой сайта. Вы можете сообщить о нарушении.