Поделиться

Maths.
Frequency tables and bar charts
:
Data total’ is the total amount of information in a mathematical study.
‘Frequency’ is how often something appears in mathematical data.
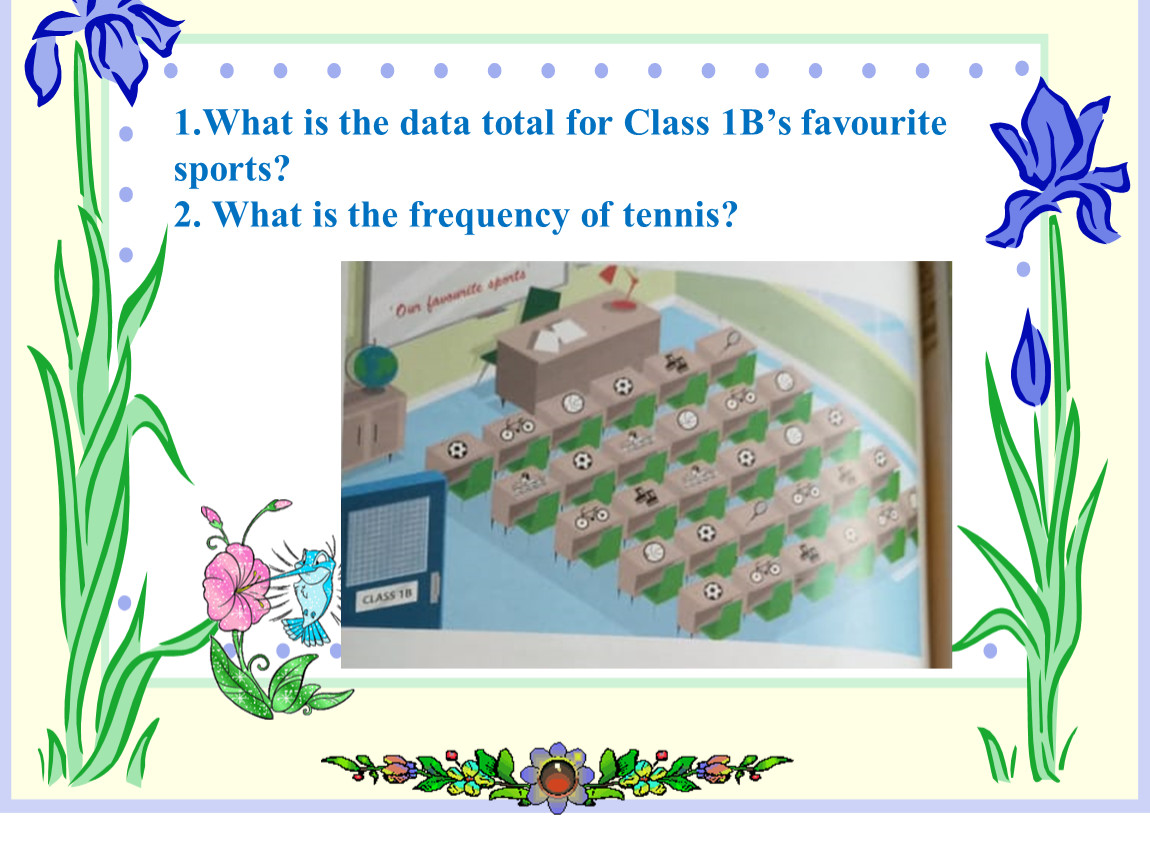
1.What is the data total for Class 1B’s favourite sports?
2. What is the frequency of tennis?
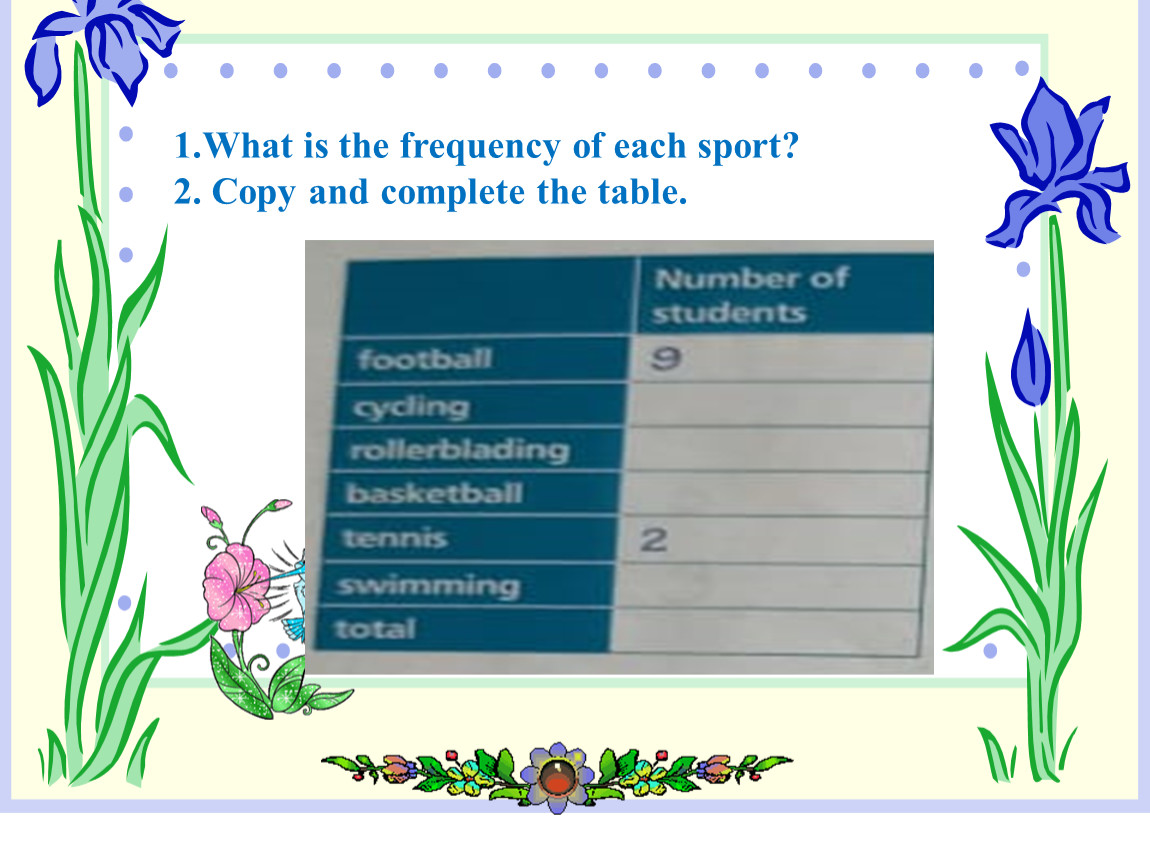
1.What is the frequency of each sport?
2. Copy and complete the table.

Look at the information from Ex2 in a bar chart. Answer the q
Answer the questions
1. Which data is wrong?
2. Which axis(X or Y) is a horizontal line? Which is a vertical line?
Homework
Ex 4p104
Make a frequency table and a bar chart with the information. Use these ideas. Ask your classmates.
*The beach
*The mountains
* a city
* visit family or friends
.
Материалы на данной страницы взяты из открытых источников либо размещены пользователем в соответствии с договором-офертой сайта. Вы можете сообщить о нарушении.