Поделиться
CREATING A DIGITAL MODEL OF FERGANA VALLEY WITH RASTIRED IMAGE
Murodilov Xasanboy Tolibjon o’g’li – Student,
GEODESY, CARTOGRAPHY AND CADASTER DEPARTMENT, CONSTRUCTION FACULTY,
FERGANA POLYTECHNIC INSTITUTE, FERGANA, REPUBLIC OF UZBEKISTAN
+998905824899
xasanboymurodilov@gmail.com
Alisherov Shoxrux Mirzohidjon o’g’li – Student,
GEODESY, CARTOGRAPHY AND CADASTER DEPARTMENT, CONSTRUCTION FACULTY,
FERGANA POLYTECHNIC INSTITUTE, FERGANA, REPUBLIC OF UZBEKISTAN
+9989934262501
alisherovshoxrux8@gmail.com
Annotation: The software of geoinformation maps, their use in solving environmental and social problems, the explosion of computer technology in recent decades has been characterized by increasing impact on all aspects of life. Complex environmental and social issues, non-homogeneous factors, indicate the acceptability of the widespread use of geographic information systems.
Keywords: anthropogenic loads, ecology, raster, vector, MarInfo, ArcGIS, QGIS, atmosphere, soil, geographic information.
I. INTRODUCTION
Given the great complexity of the study of social and environmental problems, indicators of the social and ecological situation of the Fergana Valley and their location on the ground, it is necessary to require accurate and sufficient criteria for the provision of relevant information. Sources of information about the ecological situation, the interdependence of nature and human activities due to ecological conditions, means the interdependent state of man and the environment. The data involved to characterize the ecological situation are very diverse in terms of origin and content. All data is received from different locations, measurements, measurements, film, photographs, space photographs, or from different sources, at different times - as a result of the processing of primary data, the digital models are divided into basics.
II. OBJECT AND METHODS OF RESEARCH
Information on the ecological situation of the region can be divided into four sources: information on the source and the general state of anthropogenic loads; materials of expedition and stationary researches of a condition of components of environment; data on the study of the status of bioindicators; remote sensing materials. Indicators of ecological conditions: soil, atmosphere, water, tree and grass cover, litter, soil enzymes, soil, lesofauna, population, birds, small mammals, landscape, natural conditions, climate: indicators of ecological conditions state characteristics of components of ecosystems at different hierarchical levels can detect. Indicators of the ecological status of the Fergana Valley are geochemical and biological, man-made environmental pollution, its direct and indirect effects on natural systems, but also on the health of the population, air and water, noise, electromagnetic radiation, pollution, civilian diseases increase mortality. The health of the population is the same indicator of the ecological condition of the region.
III. RESULTS
The software of geoinformation maps, their use in solving environmental and social problems, the explosion of computer technology in recent decades has been characterized by increasing impact on all aspects of life. Complex environmental and social issues, non-homogeneous factors, have shown the acceptability of widespread use on the basis of geographic information systems.
The use of modern GIS programs in social and environmental research, ie the creation of an ecological atlas of the Fergana Valley, the use of geographic information technology not only facilitates the acquisition of maps, but also interactive program tasks and faster decision-making. Creating digital and spreadsheets is a convenient tool for disclosing the activities of environmental information systems, the content of thematic maps.
IV. DISCUSSION
Common software modifications: ESRI (development of Marobjects and GisData servers for ARS / INFO and AgsView), INTERGRAPH (GeoMediaa We Mar 1.0), MarInfo, AtlasGIS and others in the creation of cartographic Internet servers (KIS). plays an important role [65; 92-b]. Using internal or additional tools, the GIS package can be customized for a specific job. The raster data model affects the world as a field where the spatial distributions of a particular event change. A pixel is used as the unit of raster data. The difference between raster data and a vector is that only one corner of the raster must be linked to an absolute system (e.g., coordinates such as distance and latitude, or other coordinate systems); the location of all other pixels can be calculated relative to the linked pixel.
Registration of the image (photo) of ecological atlas maps of the Fergana valley on coordinates in the ARCGIS program.
1. ArcMap is launched.
2. The Fergana region was connected using known coordinates of the .jpg raster map (see figure 1 and see table 1).
Table 1
Coordinates of angles for the map of Fergana region
|
|
X |
Y |
|
NW |
70,793 |
40,726 |
|
N |
71,468 |
40,738 |
|
NH |
72,181 |
40,537 |
|
SH |
71,744 |
39,91 |
|
S |
71,123 |
39,863 |
|
SW |
70,626 |
40,168 |
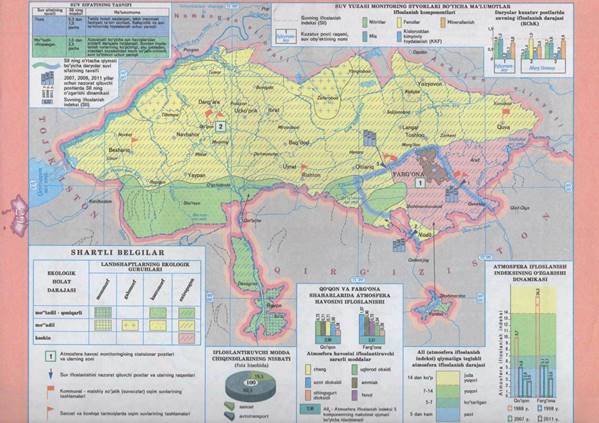
Figure 1. Privyazka card of Fergana region
To do this, the following work was done:
The project added raster to the table of contents and added the base points using the Add Space Points button on the Georeferencing panel (see figure 2).
![]()
Figure 2. Base points.
By zooming in on the raster, making the position of the base point on the map more visible, starting from the top left, the base points were added in turn, and the coordinates of these base points were entered.
From
the Georeferencing toolbar, click the Add Control Points button ![]() ,
move the mouse pointer to the base point on the map, and then left-click. When
the pointer changes color, the right mouse button is pressed without moving the
mouse. From the context menu> Incoming X and Y (Input X and Y) (Input X and
Y)> Enter Coordinates> Click OK (see figure 3).
,
move the mouse pointer to the base point on the map, and then left-click. When
the pointer changes color, the right mouse button is pressed without moving the
mouse. From the context menu> Incoming X and Y (Input X and Y) (Input X and
Y)> Enter Coordinates> Click OK (see figure 3).


Figure 3. Enter coordinates
After
entering the first coordinates, the raster disappears from the screen. In such
cases, the Full Extension button is pressed or the Layer Zoom operation is
performed from the context menu of the layer ![]() (see
figure 4).
(see
figure 4).

Figure 4. Zoom in.
V. CONCLUSION
In this way the remaining coordinates are entered for the reference points. The Connections table is then opened and errors in raster binding are checked. If there are sharply different error values during raster registration, the base point is removed and the base point input operation is performed again. The raster must be connected with an error of no more than 30 meters.
Reshaped the raster according to the selected transformation method. This process is carried out as follows. Spatial binding menu (Prostranstvennaya privyazka) (Georeferencing)> Transformation (Rectify) (see figure 5)


Figure 5. Spatial binding
• Ferghana region.tif file was created by filling in the fields of the Transformation Results window.
• After the transformation, the Fergana region.jpg raster is removed from the table of contents and the Fergana region.tif raster is added.
VI. REFERENCES
1. Safarov E.Y. Geographic information systems. - Tashkent, University, 2010.-80 p.
2. Safarov E.Yu., Musaev I.M., Abdurahimov H.A. Geoinformation systems and technologies. Study guide. Tashkent, 2008. -148 p.
3. Torbin S.Yu. Development of methods for creating electronic uchebnogo regionalalnogo ekologicheskogo atlas. Autoref. Dis. Kand. techn. nauk - M., 2001. - 114 p.
4. Egamberdiev A., Khakimova K.R. Atlases are a unique cartographic encyclopedia. // Information of the Geographical Society of Uzbekistan. Volume 46 - T., 2015. -226 – 228 p.
Скачано с www.znanio.ru
Материалы на данной страницы взяты из открытых источников либо размещены пользователем в соответствии с договором-офертой сайта. Вы можете сообщить о нарушении.