Поделиться
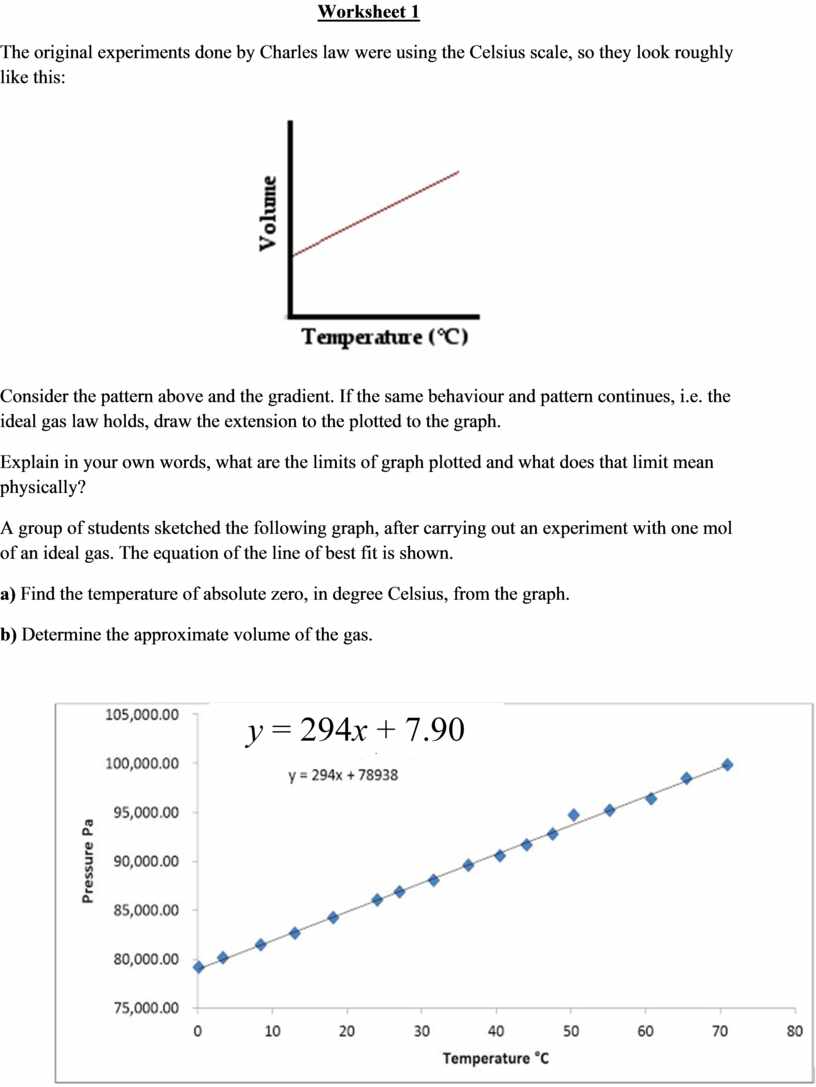
Worksheet 1
The original experiments done by Charles law were using the Celsius scale, so they look roughly like this:
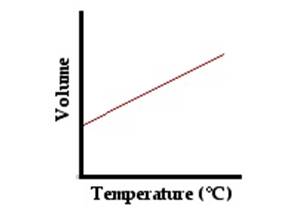
Consider the pattern above and the gradient. If the same behaviour and pattern continues, i.e. the ideal gas law holds, draw the extension to the plotted to the graph.
Explain in your own words, what are the limits of graph plotted and what does that limit mean physically?
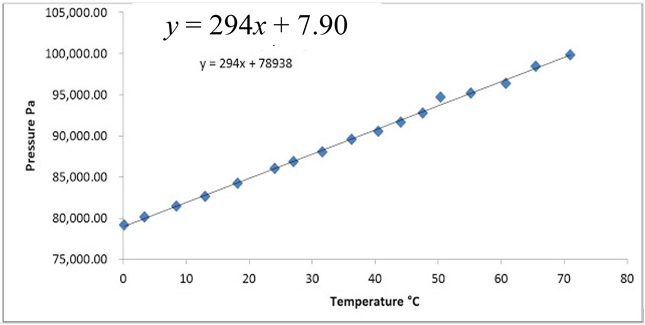 A group of
students sketched the following graph, after carrying out an experiment with
one mol of an ideal gas. The equation of the line of best fit is shown.
A group of
students sketched the following graph, after carrying out an experiment with
one mol of an ideal gas. The equation of the line of best fit is shown.
a) Find the temperature of absolute zero, in degree Celsius, from the graph.
b) Determine the approximate volume of the gas.
Материалы на данной страницы взяты из открытых источников либо размещены пользователем в соответствии с договором-офертой сайта. Вы можете сообщить о нарушении.