Поделиться

Introduction to reports in Access
Access for Office 365 Access 2019 Access 2016 Access 2013 Access 2010 Access 2007
Reports offer a way to view, format, and summarize the information in your Microsoft Access database. For example, you can create a simple report of phone numbers for all your contacts, or a summary report on the total sales across different regions and time periods.
From this article, you’ll get an overview of reports in Access. You’ll also learn the basics of creating a report, and using options like sorting, grouping, and summarizing the data, and how to preview and print the report.
Note: The information in this article is intended for use only with Access desktop databases. Access web apps don't support reports.
In this article
Overview of reports in Access
Create a report in Access
Add grouping, sorting, or totals
Highlight data with conditional formatting
Customizing color and fonts
Add a logo or background image
Preview and print a report
Overview of reports in Access
What can you do with a report?
A report is a database object that comes in handy when you want to present the information in your database for any of the following uses:
· Display or distribute a summary of data.
· Archive snapshots of the data.
· Provide details about individual records.
· Create labels.
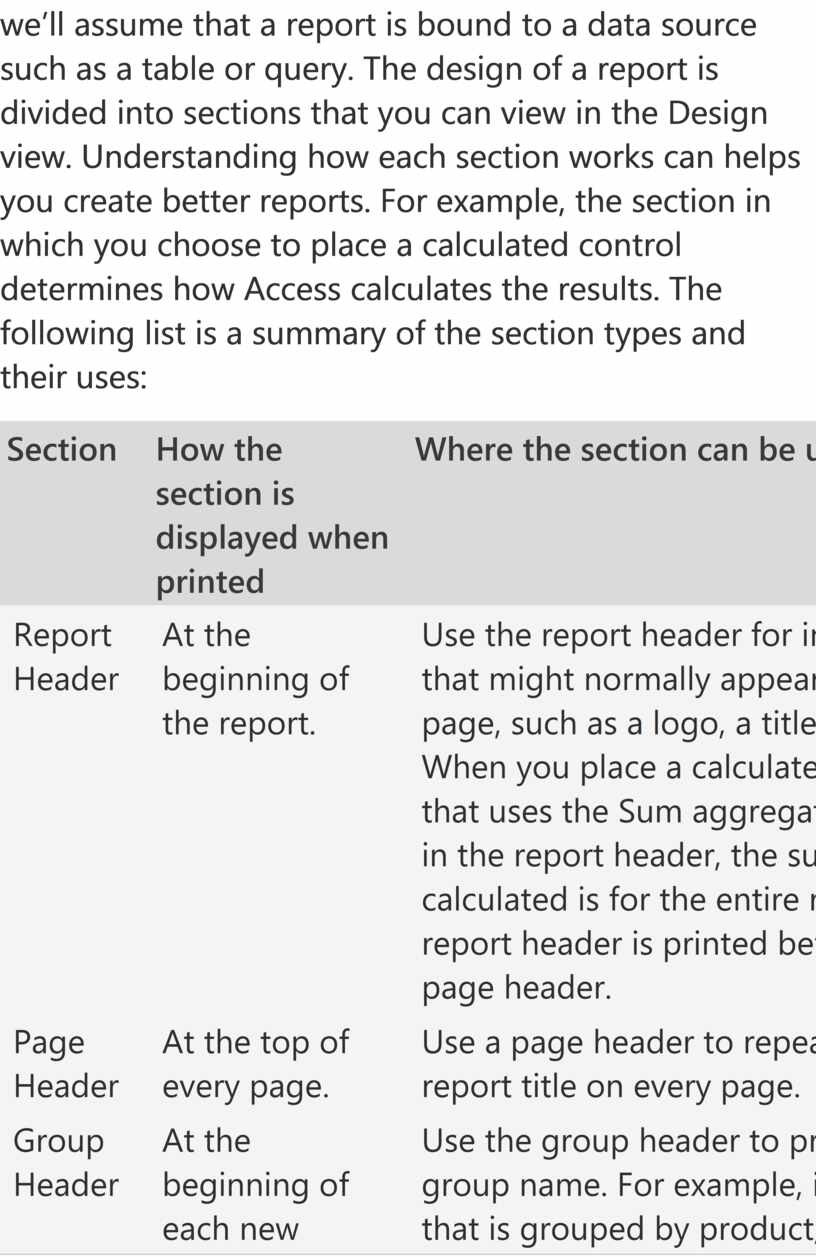
Parts of a report
While it is possible to create “unbound” reports that do not display data, but for the purposes of this article, we’ll assume that a report is bound to a data source such as a table or query. The design of a report is divided into sections that you can view in the Design view. Understanding how each section works can helps you create better reports. For example, the section in which you choose to place a calculated control determines how Access calculates the results. The following list is a summary of the section types and their uses:
|
Section |
How the section is displayed when printed |
Where the section can be used |
|
Report Header |
At the beginning of the report. |
Use the report header for information that might normally appear on a cover page, such as a logo, a title, or a date. When you place a calculated control that uses the Sum aggregate function in the report header, the sum calculated is for the entire report. The report header is printed before the page header. |
|
Page Header |
At the top of every page. |
Use a page header to repeat the report title on every page. |
|
Group Header |
At the beginning of each new group of records. |
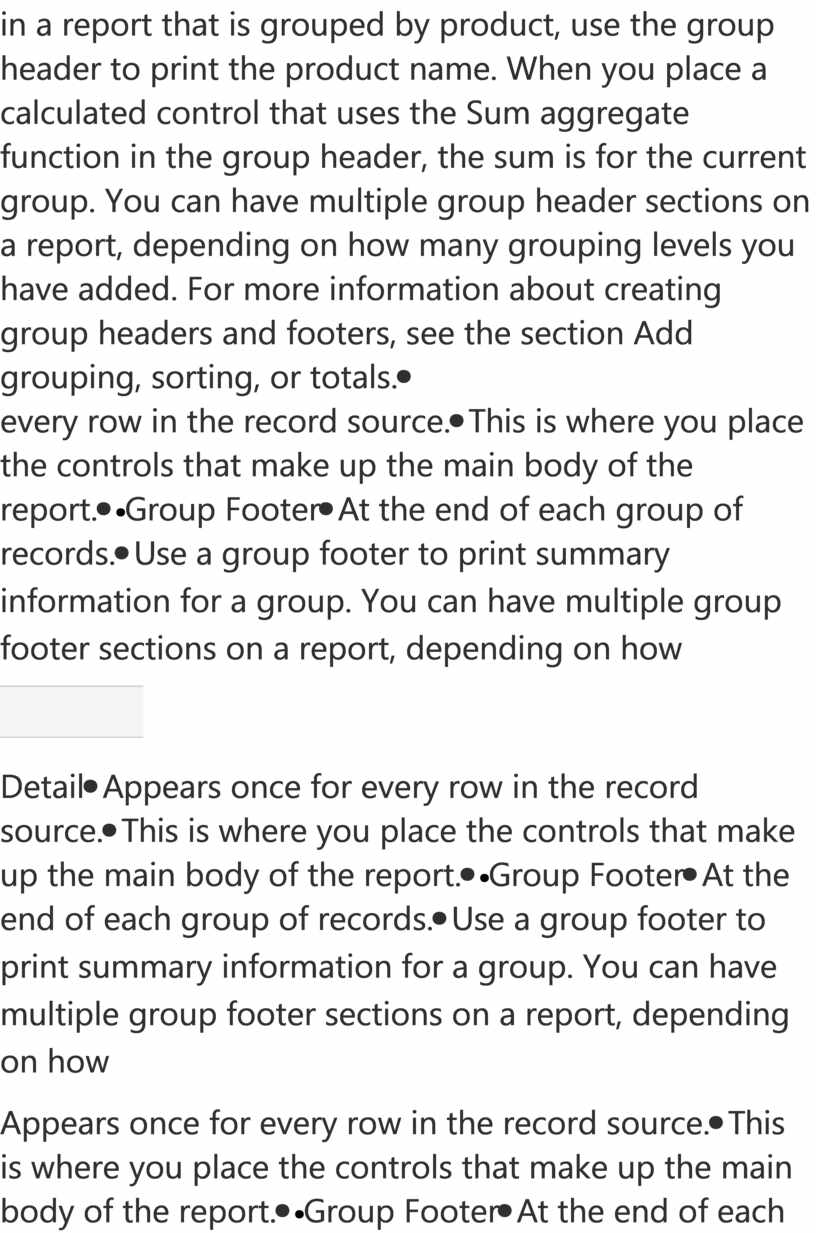
Use the group header to print the group name. For example, in a report that is grouped by product, use the group header to print the product name. When you place a calculated control that uses the Sum aggregate function in the group header, the sum is for the current group. You can have multiple group header sections on a report, depending on how many grouping levels you have added. For more information about creating group headers and footers, see the section Add grouping, sorting, or totals. |
|
Detail |
Appears once for every row in the record source. |
This is where you place the controls that make up the main body of the report. |
|
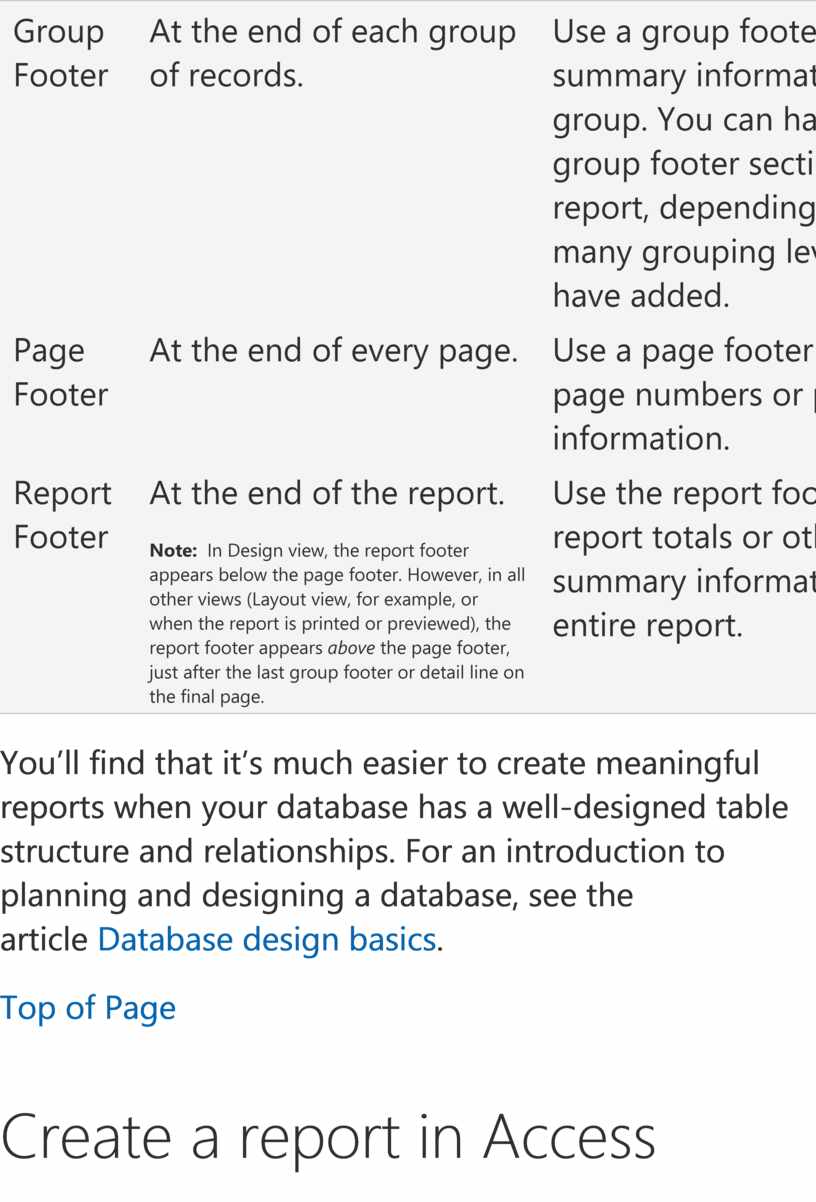
Group Footer |
At the end of each group of records. |
Use a group footer to print summary information for a group. You can have multiple group footer sections on a report, depending on how many grouping levels you have added. |
|
Page Footer |
At the end of every page. |
Use a page footer to print page numbers or per-page information. |
|
Report Footer |
At the end of the report. Note: In Design view, the report footer appears below the page footer. However, in all other views (Layout view, for example, or when the report is printed or previewed), the report footer appears above the page footer, just after the last group footer or detail line on the final page. |
Use the report footer to print report totals or other summary information for the entire report. |
You’ll find that it’s much easier to create meaningful reports when your database has a well-designed table structure and relationships. For an introduction to planning and designing a database, see the article Database design basics.
Top of Page
Create a report in Access
You can create reports for you Access desktop database by following the steps below:
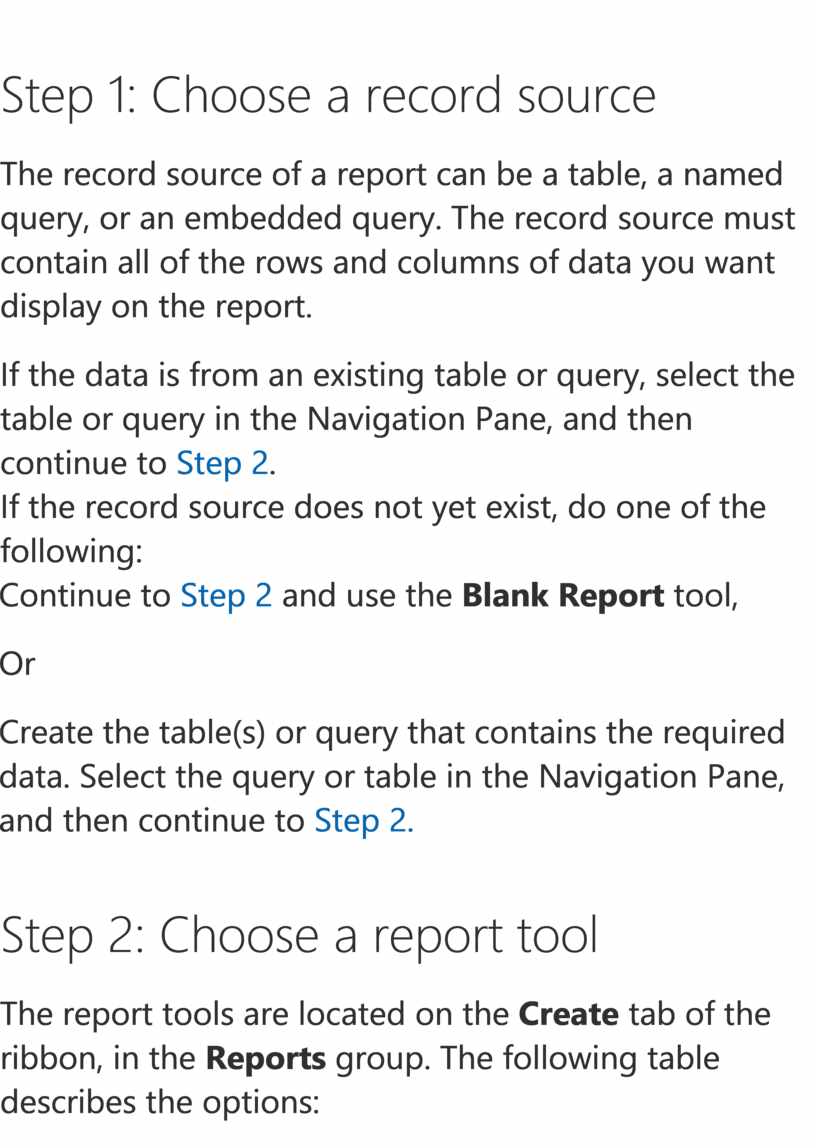
Step 1: Choose a record source
The record source of a report can be a table, a named query, or an embedded query. The record source must contain all of the rows and columns of data you want display on the report.
· If the data is from an existing table or query, select the table or query in the Navigation Pane, and then continue to Step 2.
· If the record source does not yet exist, do one of the following:
o Continue to Step 2 and use the Blank Report tool,
Or
o Create the table(s) or query that contains the required data. Select the query or table in the Navigation Pane, and then continue to Step 2.
Step 2: Choose a report tool
The report tools are located on the Create tab of the ribbon, in the Reports group. The following table describes the options:
|
Tool |
Description |
|
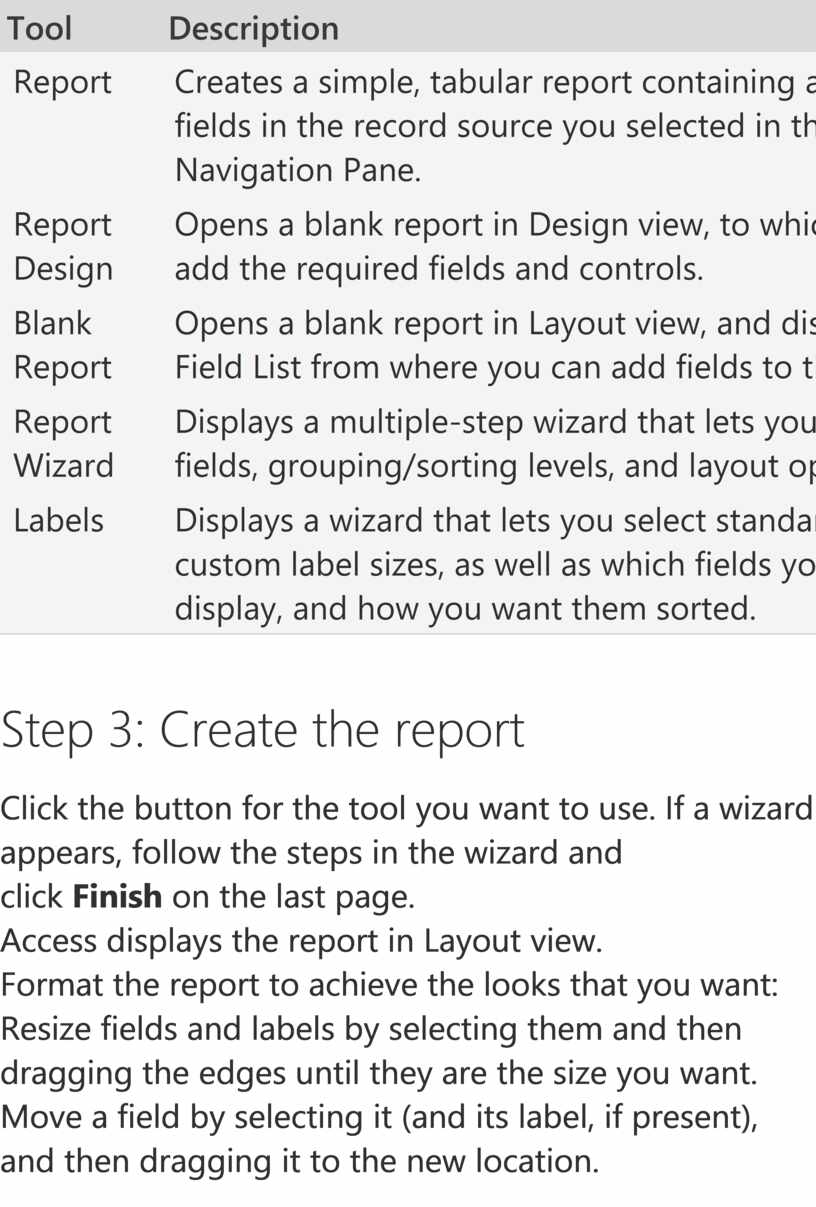
Report |
Creates a simple, tabular report containing all of the fields in the record source you selected in the Navigation Pane. |
|
Report Design |
Opens a blank report in Design view, to which you can add the required fields and controls. |
|
Blank Report |
Opens a blank report in Layout view, and displays the Field List from where you can add fields to the report |
|
Report Wizard |
Displays a multiple-step wizard that lets you specify fields, grouping/sorting levels, and layout options. |
|
Labels |
Displays a wizard that lets you select standard or custom label sizes, as well as which fields you want to display, and how you want them sorted. |
Step 3: Create the report
1. Click
the button for the tool you want to use. If a wizard appears, follow the steps
in the wizard and click Finish on the last page.
Access displays the report in Layout view.
2. Format the report to achieve the looks that you want:
o Resize fields and labels by selecting them and then dragging the edges until they are the size you want.
o Move a field by selecting it (and its label, if present), and then dragging it to the new location.
o Right-click a field and use the commands on the shortcut menu to merge or split cells, delete or select fields, and perform other formatting tasks.
In addition, you can use the features described in the following sections to make your report more attractive and readable.
Top of Page
Add grouping, sorting, or totals
The fastest way to add grouping, sorting, or totals to a desktop database report is to right-click the field to which you want to apply the group, sort, or total, and then click the desired command on the shortcut menu.
You can also add grouping, sorting, or totals by using the Group, Sort, and Total pane while the report is open in Layout view or Design view:
1. If the Group, Sort, and Total pane is not already open, on the Design tab, in the Grouping and Totalsgroup, click Group & Sort.
2. Click Add a group or Add a sort, and then select the field on which you want to group or sort.
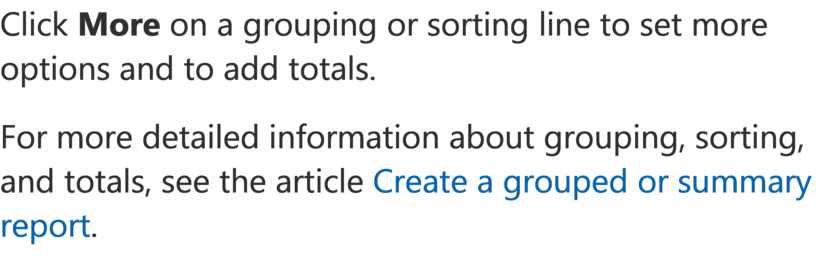
3. Click More on a grouping or sorting line to set more options and to add totals.
For more detailed information about grouping, sorting, and totals, see the article Create a grouped or summary report.
Скачано с www.znanio.ru
Материалы на данной страницы взяты из открытых источников либо размещены пользователем в соответствии с договором-офертой сайта. Вы можете сообщить о нарушении.