Поделиться

![]() THIS
IS A PRACTICE ASSESSMENT. Show formulas, substitutions, answers (in spaces
provided) and units!
THIS
IS A PRACTICE ASSESSMENT. Show formulas, substitutions, answers (in spaces
provided) and units!
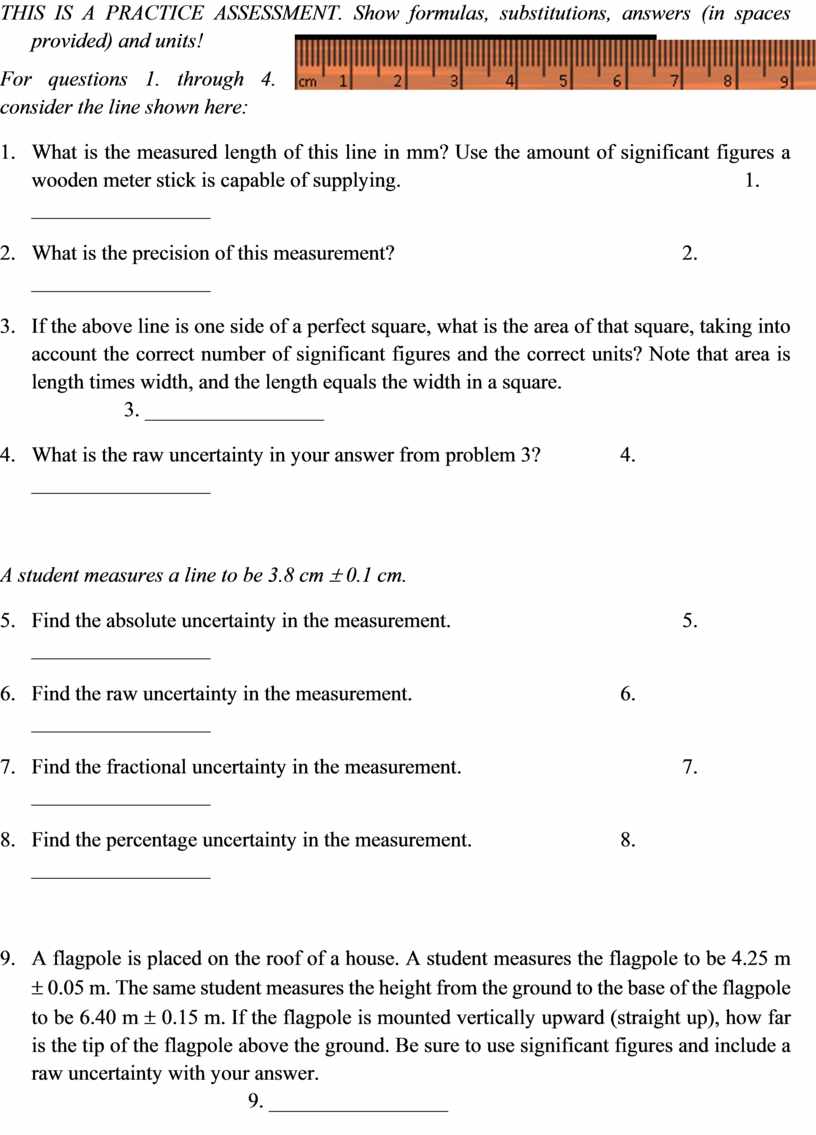
For questions 1. through 4. consider the line shown here:
1. What is the measured length of this line in mm? Use the amount of significant figures a wooden meter stick is capable of supplying. 1. _________________
2. What is the precision of this measurement? 2. _________________
3. If the above line is one side of a perfect square, what is the area of that square, taking into account the correct number of significant figures and the correct units? Note that area is length times width, and the length equals the width in a square. 3. _________________
4. What is the raw uncertainty in your answer from problem 3? 4. _________________
A student measures a line to be 3.8 cm ± 0.1 cm.
5. Find the absolute uncertainty in the measurement. 5. _________________
6. Find the raw uncertainty in the measurement. 6. _________________
7. Find the fractional uncertainty in the measurement. 7. _________________
8. Find the percentage uncertainty in the measurement. 8. _________________
9. A flagpole is placed on the roof of a house. A student measures the flagpole to be 4.25 m ± 0.05 m. The same student measures the height from the ground to the base of the flagpole to be 6.40 m ± 0.15 m. If the flagpole is mounted vertically upward (straight up), how far is the tip of the flagpole above the ground. Be sure to use significant figures and include a raw uncertainty with your answer. 9. _________________
10. A car travels 250 m ± 15 m in 12.2 s ± 0.2 s. Calculate its speed. Be sure to use significant figures and include a raw uncertainty with your answer. 10. ________________
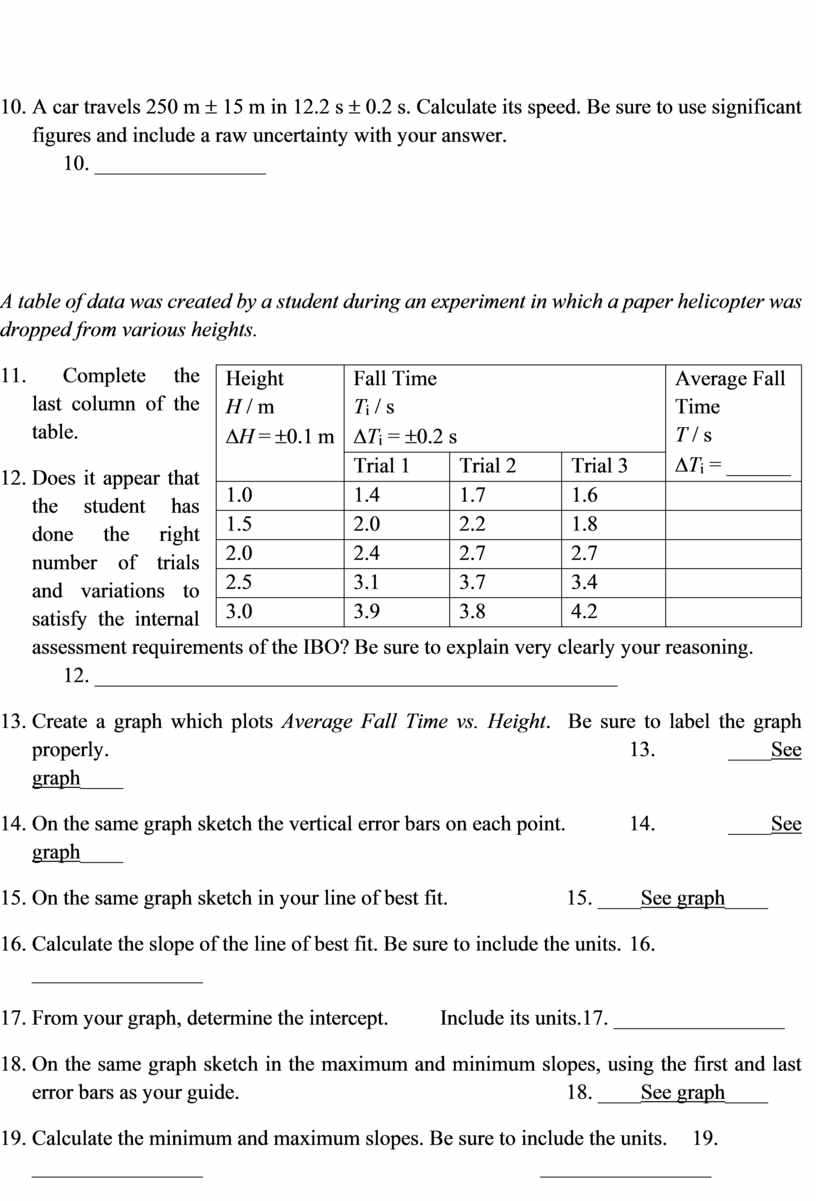
A table of data was created by a student during an experiment in which a paper helicopter was dropped from various heights.
|
Height H / m DH = ±0.1 m |
Fall Time Ti / s DTi = ±0.2 s |
Average Fall Time T / s DTi = ______ |
||
|
Trial 1 |
Trial 2 |
Trial 3 |
||
|
1.0 |
1.4 |
1.7 |
1.6 |
|
|
1.5 |
2.0 |
2.2 |
1.8 |
|
|
2.0 |
2.4 |
2.7 |
2.7 |
|
|
2.5 |
3.1 |
3.7 |
3.4 |
|
|
3.0 |
3.9 |
3.8 |
4.2 |
|
11. Complete the last column of the table.
12. Does it appear that the student has done the right number of trials and variations to satisfy the internal assessment requirements of the IBO? Be sure to explain very clearly your reasoning. 12. _________________________________________________
13. Create a graph which plots Average Fall Time vs. Height. Be sure to label the graph properly. 13. ____See graph____
14. On the same graph sketch the vertical error bars on each point. 14. ____See graph____
15. On the same graph sketch in your line of best fit. 15. ____See graph____
16. Calculate the slope of the line of best fit. Be sure to include the units. 16. ________________
17. From your graph, determine the intercept. Include its units.17. ________________
18. On the same graph sketch in the maximum and minimum slopes, using the first and last error bars as your guide. 18. ____See graph____
19. Calculate the minimum and maximum slopes. Be sure to include the units. 19. ________________ ________________
20. Calculate the uncertainty of the slope. 20. ________________
21. What are the intercepts of the lines representing the minimum and maximum slopes?
21. ________________ ________________
22. Calculate the uncertainty of the intercept. 22. ________________
23. State, in words, the slope (and uncertainty) of your graph and its physical meaning.
24. State, in words, the intercept (and uncertainty) of your graph and its physical meaning.
Материалы на данной страницы взяты из открытых источников либо размещены пользователем в соответствии с договором-офертой сайта. Вы можете сообщить о нарушении.