Поделиться

|
Long-term plan unit: Physical Measurement |
School: |
|||||||
|
Date: |
Teacher name: |
|||||||
|
Grade: 11 |
Number present: |
absent: |
||||||
|
Theme of the lesson |
Laboratory work – defining acceleration of a body moving on an inclined plane |
|||||||
|
Learning objectives that are achieved at this lesson(Subject Programme reference) |
· show an understanding of the distinction between systematic errors (including zero errors) and random errors; · calculate uncertainties (including graphically) |
|||||||
|
Lesson objectives |
· Give an example of a systematic and random error in a laboratory experiment · Calculate the uncertainties in experimental data |
|||||||
|
Success criteria
|
• Demonstrates the choice of a reasonable number of decimal places for measurements and can use this in successive calculations. • Knows the concept of systematic error. • Knows the concept of statistical (random) error. • Finds a difference between systematic and statistical (random) errors. • Knowshowtodetermineuncertainties • Definesuncertainties |
|||||||
|
Language objectives |
Subject-specific vocabulary & terminology: all SI units and their multiples and submultiples encountered in the subject programme. E.g. gigawatt, picofarad, measurement, uncertainty, error, zero error, systematic, random Useful sets of phrases for dialogue and writing: The magnitude of the force on the train is 210 kilonewton (kN). Mass is a scalar quantity. Velocity is a vector quantity and it has a direction as well as a magnitude. |
|||||||
|
ICT skills |
Use of calculators. |
|||||||
|
Previous learning
|
Students have studied uncertainty and its calculation in 10th grade physics, and have been required to calculate uncertainty in 10 grade laboratory works. |
|||||||
|
Course of the lesson |
||||||||
|
Planned stages of the lesson |
Planned activities at the lesson |
Resources |
||||||
|
Beginning of L1
5 min
|
Organizational moment to acquaint students with the · Theme of the lesson · The objectives of the lesson · The criteria of success for the lesson · The plan of events for the lesson · The safety procedures to be followed during the lesson · The connection of the lesson to the school’s mission and vision and global citizenship |
Projector, presentation |
||||||
|
Middle of L1 33 min |
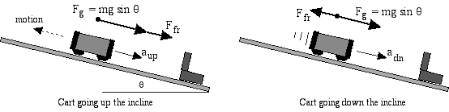
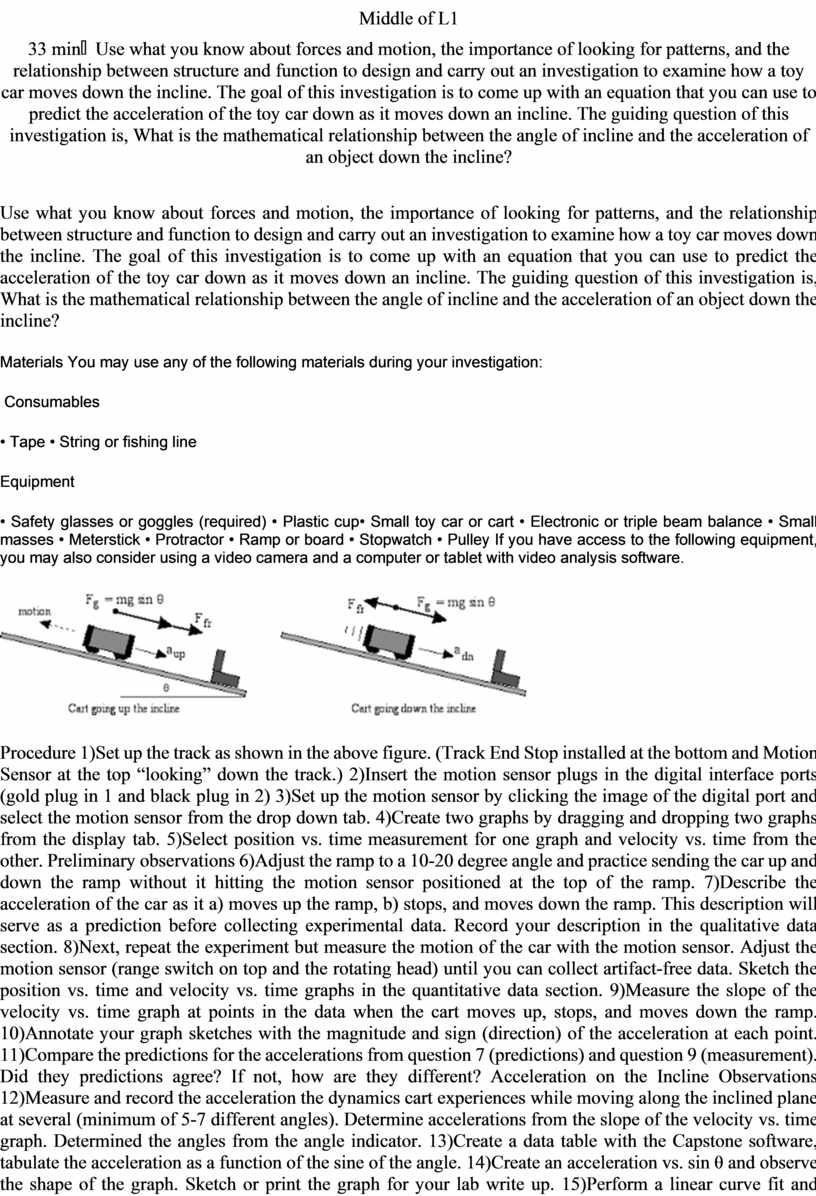
Use what you know about forces and motion, the importance of looking for patterns, and the relationship between structure and function to design and carry out an investigation to examine how a toy car moves down the incline. The goal of this investigation is to come up with an equation that you can use to predict the acceleration of the toy car down as it moves down an incline. The guiding question of this investigation is, What is the mathematical relationship between the angle of incline and the acceleration of an object down the incline? Materials You may use any of the following materials during your investigation: Consumables • Tape • String or fishing line Equipment • Safety glasses or goggles (required) • Plastic cup• Small toy car or cart • Electronic or triple beam balance • Small masses • Meterstick • Protractor • Ramp or board • Stopwatch • Pulley If you have access to the following equipment, you may also consider using a video camera and a computer or tablet with video analysis software.
Procedure 1)Set up the track as shown in the above figure. (Track End Stop installed at the bottom and Motion Sensor at the top “looking” down the track.) 2)Insert the motion sensor plugs in the digital interface ports (gold plug in 1 and black plug in 2) 3)Set up the motion sensor by clicking the image of the digital port and select the motion sensor from the drop down tab. 4)Create two graphs by dragging and dropping two graphs from the display tab. 5)Select position vs. time measurement for one graph and velocity vs. time from the other. Preliminary observations 6)Adjust the ramp to a 10-20 degree angle and practice sending the car up and down the ramp without it hitting the motion sensor positioned at the top of the ramp. 7)Describe the acceleration of the car as it a) moves up the ramp, b) stops, and moves down the ramp. This description will serve as a prediction before collecting experimental data. Record your description in the qualitative data section. 8)Next, repeat the experiment but measure the motion of the car with the motion sensor. Adjust the motion sensor (range switch on top and the rotating head) until you can collect artifact-free data. Sketch the position vs. time and velocity vs. time graphs in the quantitative data section. 9)Measure the slope of the velocity vs. time graph at points in the data when the cart moves up, stops, and moves down the ramp. 10)Annotate your graph sketches with the magnitude and sign (direction) of the acceleration at each point. 11)Compare the predictions for the accelerations from question 7 (predictions) and question 9 (measurement). Did they predictions agree? If not, how are they different? Acceleration on the Incline Observations 12)Measure and record the acceleration the dynamics cart experiences while moving along the inclined plane at several (minimum of 5-7 different angles). Determine accelerations from the slope of the velocity vs. time graph. Determined the angles from the angle indicator. 13)Create a data table with the Capstone software, tabulate the acceleration as a function of the sine of the angle. 14)Create an acceleration vs. sin θ and observe the shape of the graph. Sketch or print the graph for your lab write up. 15)Perform a linear curve fit and recording the slope, and R 2 value. 16)What is the physical meaning of the slope? Compare the slope to the expected value. 17)What is the meaning of the R 2 value? How could you improve the experiment to increase the reliability of the curve fit? 18)Repeat the experiment (steps 12 -17) after doubling the mass of the car (place a 250 g mass bar in the car). Before conducting the experiment predict the impact on acceleration after increasing the mass of the car. |
Laboratory equipment |
||||||
|
End of L1
2 min |
Reflection: Thumbs up/middle/down Teacher will ask students to respond to the following questions at the end of the first lesson by putting their thumb up for “good,” in the middle for “O.K.” and down for “bad.” · I think I am performing or have performed the laboratory work correctly so far · I know how to correctly finish the remaining parts of the laboratory work. |
Presentation with questions. |
||||||
|
Differentiation – how do you plan to give more support? How do you plan to challenge the more able learners? |
Assessment – how are you planning to check students’ learning? |
Health and safety regulations |
||||||
|
Students will be encouraged to select problems from each set that are challenging but doable for them. |
During group work, teachers will circulate around the room to informally assess students. |
Students will be given a short break in the middle of the lesson to stretch and move around. |
||||||
|
Reflection
Were the lesson objectives/learning objectives realistic? Did all learners achieve the LO? If not, why? Did my planned differentiation work well? Did I stick to timings? What changes did I make from my plan and why?
|
Use the space below to reflect on your lesson. Answer the most relevant questions from the box on the left about your lesson. |
|||||||
|
|
||||||||
|
Summary evaluation
What two things went really well (consider both teaching and learning)? 1:
2:
What two things would have improved the lesson (consider both teaching and learning)? 1:
2:
What have I learned from this lesson about the class orachievements/difficulties of individuals that will inform my next lesson?
|
||||||||
Материалы на данной страницы взяты из открытых источников либо размещены пользователем в соответствии с договором-офертой сайта. Вы можете сообщить о нарушении.