Поделиться

Physical Measurement
Laboratory work – defining acceleration of a body moving on an inclined plane
Оbjectives
Give an example of a systematic and random error in a laboratory experiment
Calculate the uncertainties in experimental data
Success criteria
Demonstrates the choice of a reasonable number of decimal places for measurements and can use this in successive calculations.
Knows the concept of systematic error.
Knows the concept of statistical (random) error.
Finds a difference between systematic and statistical (random) errors.
Knows how to determine uncertainties
Defines uncertainties
Language objectives
Subject-specific vocabulary & terminology:
all SI units and their multiples and submultiples encountered in the subject programme. E.g. gigawatt, picofarad, measurement, uncertainty, error, zero error, systematic, random
Useful sets of phrases for dialogue and writing:
The magnitude of the force on the train is 210 kilonewton (kN).
Mass is a scalar quantity.
Velocity is a vector quantity and it has a direction as well as a magnitude.
Measuring instruments: 1) measuring tape; 2) metronome
Materials: 1) chute/track; 2) cart; 3) tripod with a moveable clamp; 4) metal cylinder.
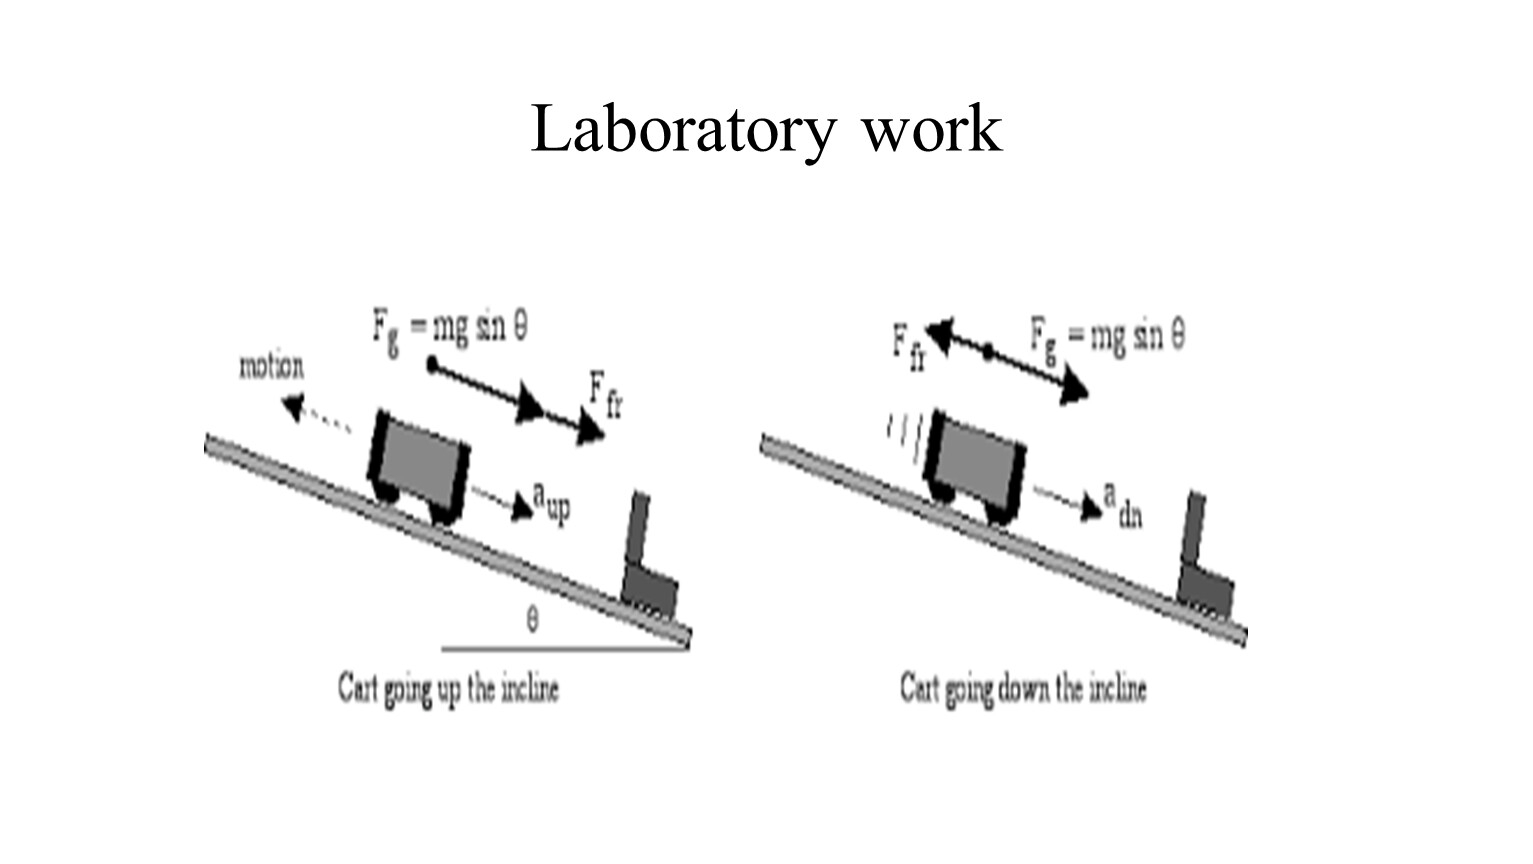
Laboratory work
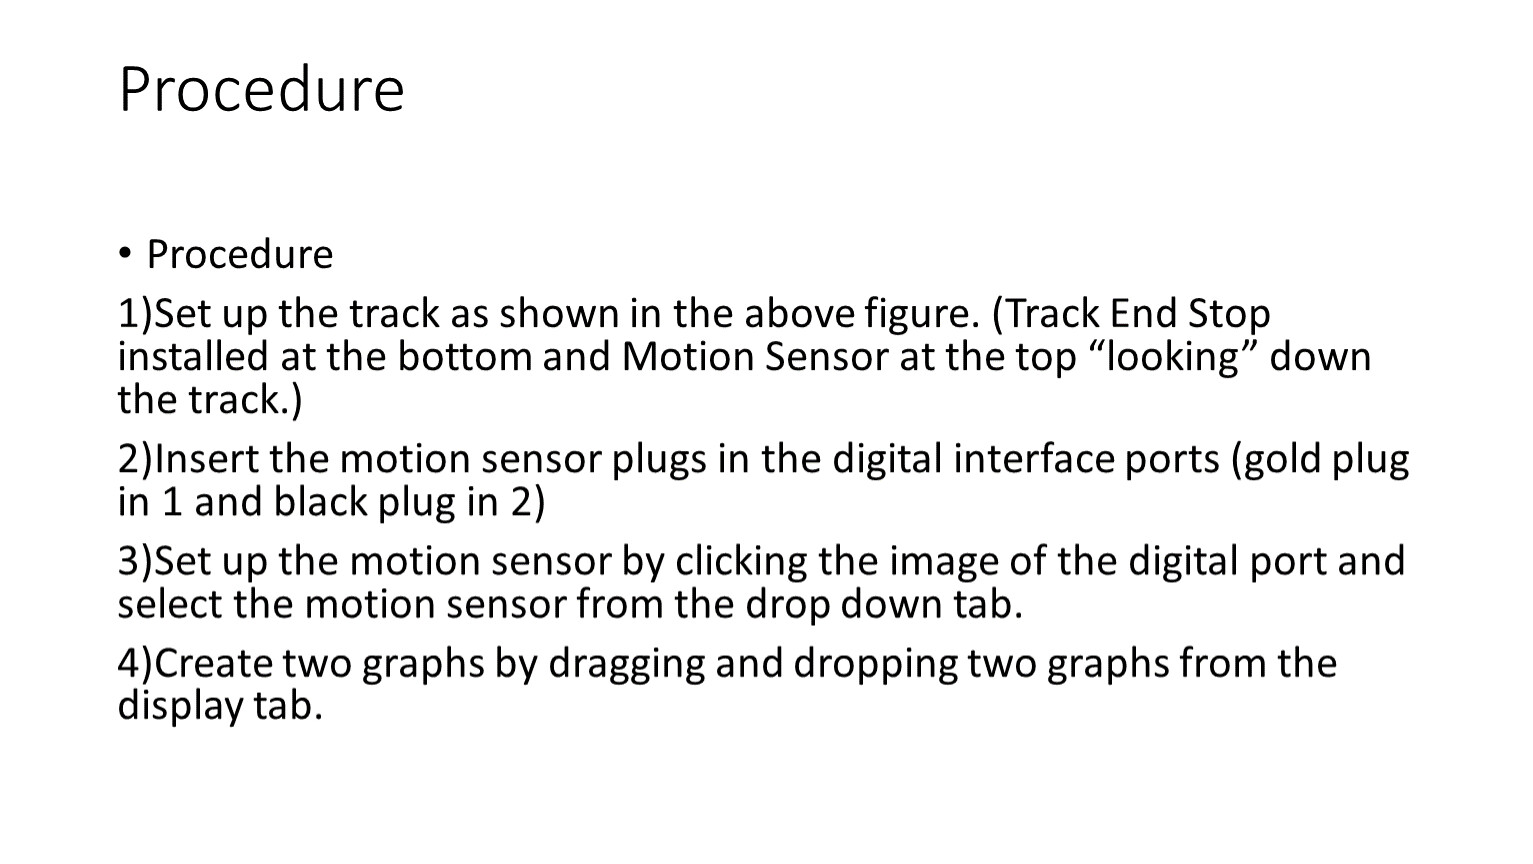
Procedure
Procedure
1)Set up the track as shown in the above figure. (Track End Stop installed at the bottom and Motion Sensor at the top “looking” down the track.)
2)Insert the motion sensor plugs in the digital interface ports (gold plug in 1 and black plug in 2)
3)Set up the motion sensor by clicking the image of the digital port and select the motion sensor from the drop down tab.
4)Create two graphs by dragging and dropping two graphs from the display tab.
5)Select position vs. time measurement for one graph and velocity vs. time from the other
6)Adjust the ramp to a 10-20 degree angle and practice sending the car up and down the ramp without it hitting the motion sensor positioned at the top of the ramp.
7)Describe the acceleration of the car as it a) moves up the ramp, b) stops, and moves down the ramp. This description will serve as a prediction before collecting experimental data. Record your description in the qualitative data section.
8)Next, repeat the experiment but measure the motion of the car with the motion sensor. Adjust the motion sensor (range switch on top and the rotating head) until you can collect artifact-free data. Sketch the position vs. time and velocity vs. time graphs in the quantitative data section.
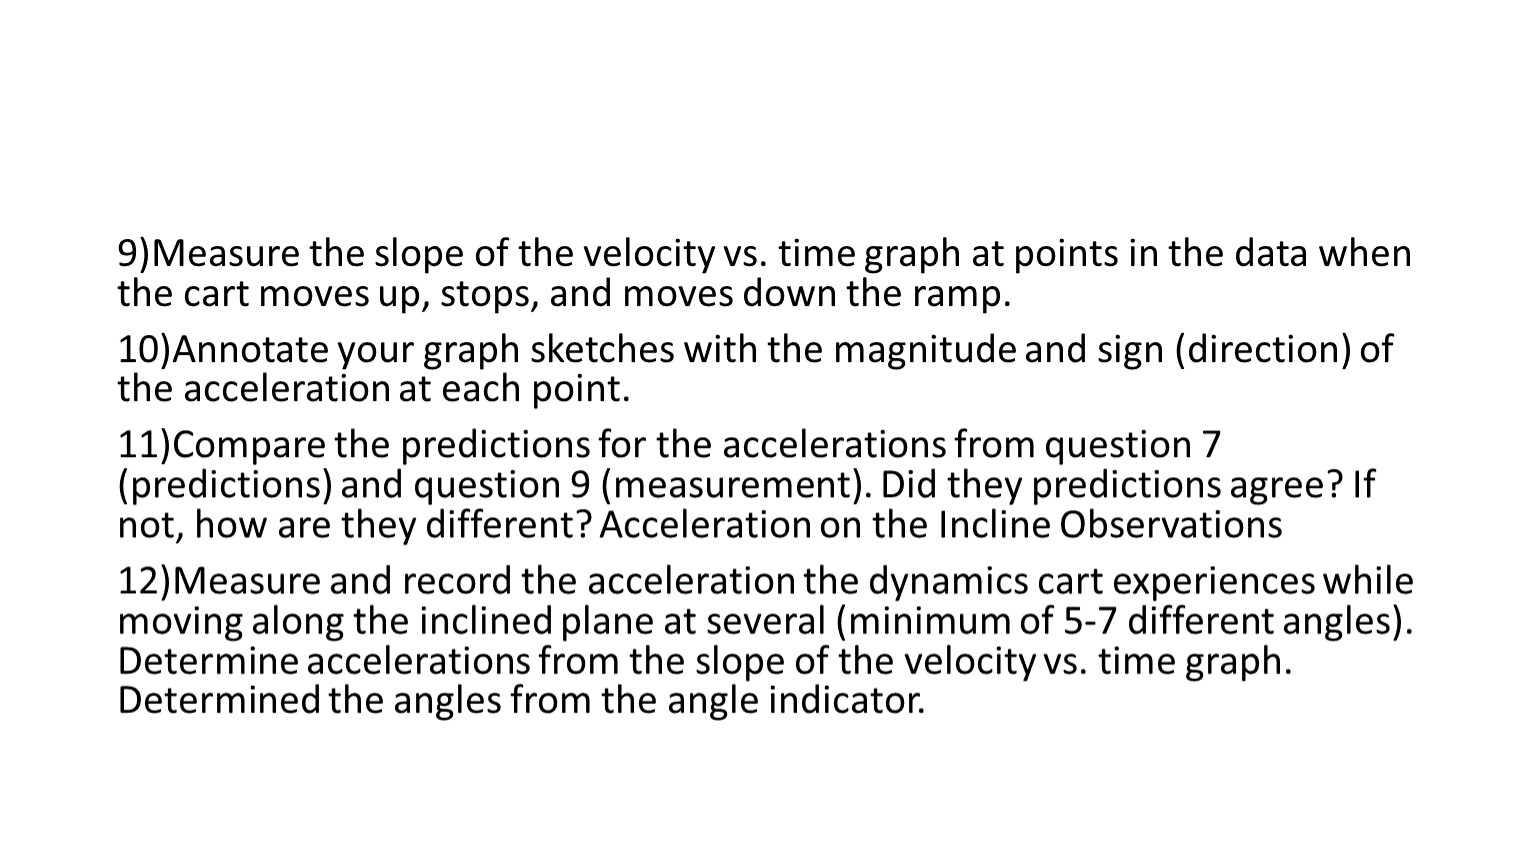
9)Measure the slope of the velocity vs. time graph at points in the data when the cart moves up, stops, and moves down the ramp.
10)Annotate your graph sketches with the magnitude and sign (direction) of the acceleration at each point.
11)Compare the predictions for the accelerations from question 7 (predictions) and question 9 (measurement). Did they predictions agree? If not, how are they different? Acceleration on the Incline Observations
12)Measure and record the acceleration the dynamics cart experiences while moving along the inclined plane at several (minimum of 5-7 different angles). Determine accelerations from the slope of the velocity vs. time graph. Determined the angles from the angle indicator.
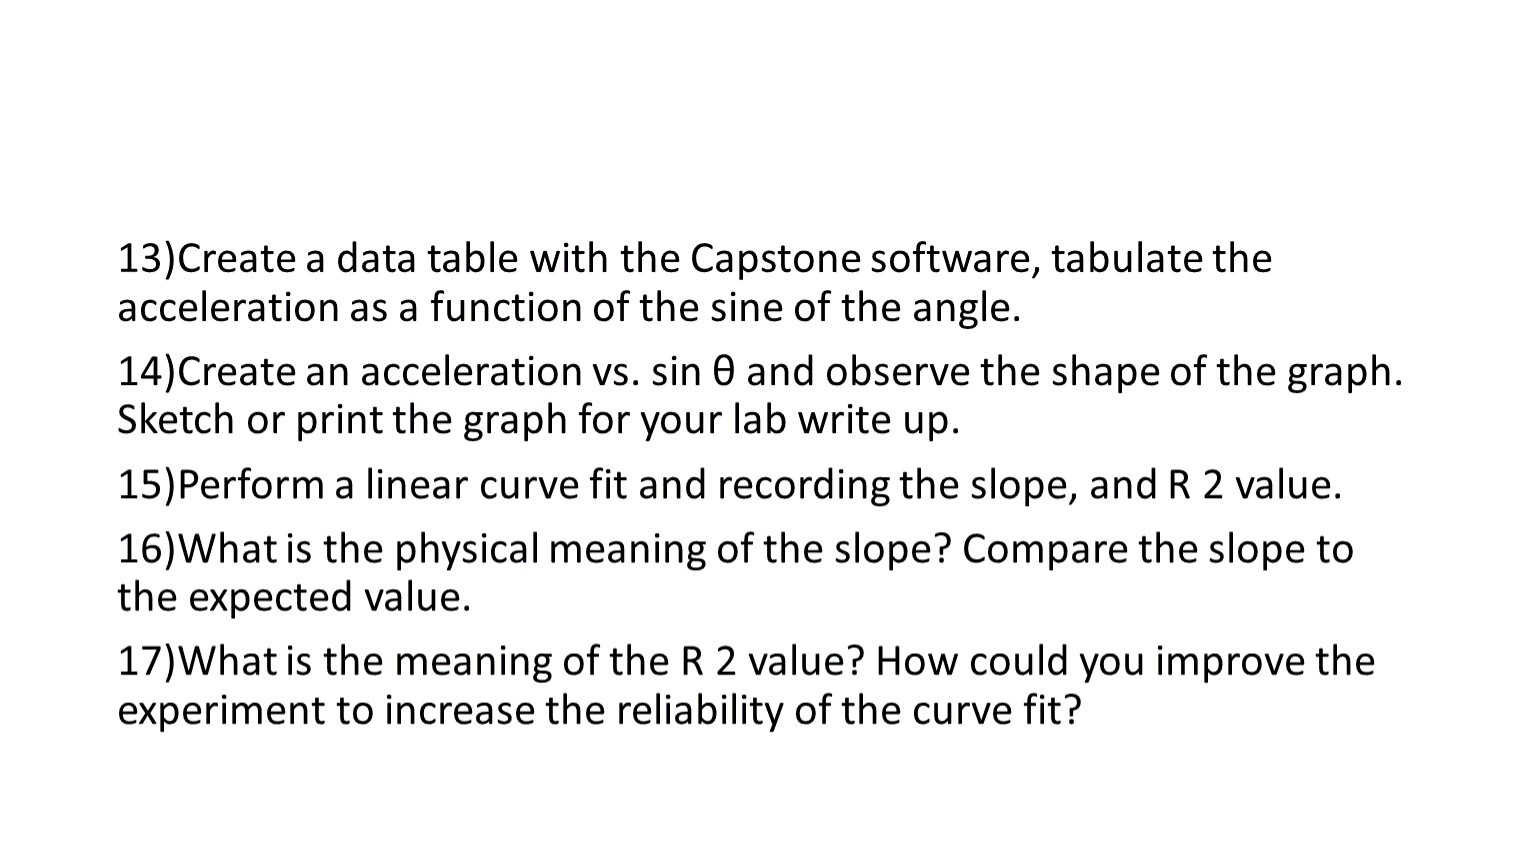
13)Create a data table with the Capstone software, tabulate the acceleration as a function of the sine of the angle.
14)Create an acceleration vs. sin θ and observe the shape of the graph. Sketch or print the graph for your lab write up.
15)Perform a linear curve fit and recording the slope, and R 2 value.
16)What is the physical meaning of the slope? Compare the slope to the expected value.
17)What is the meaning of the R 2 value? How could you improve the experiment to increase the reliability of the curve fit?
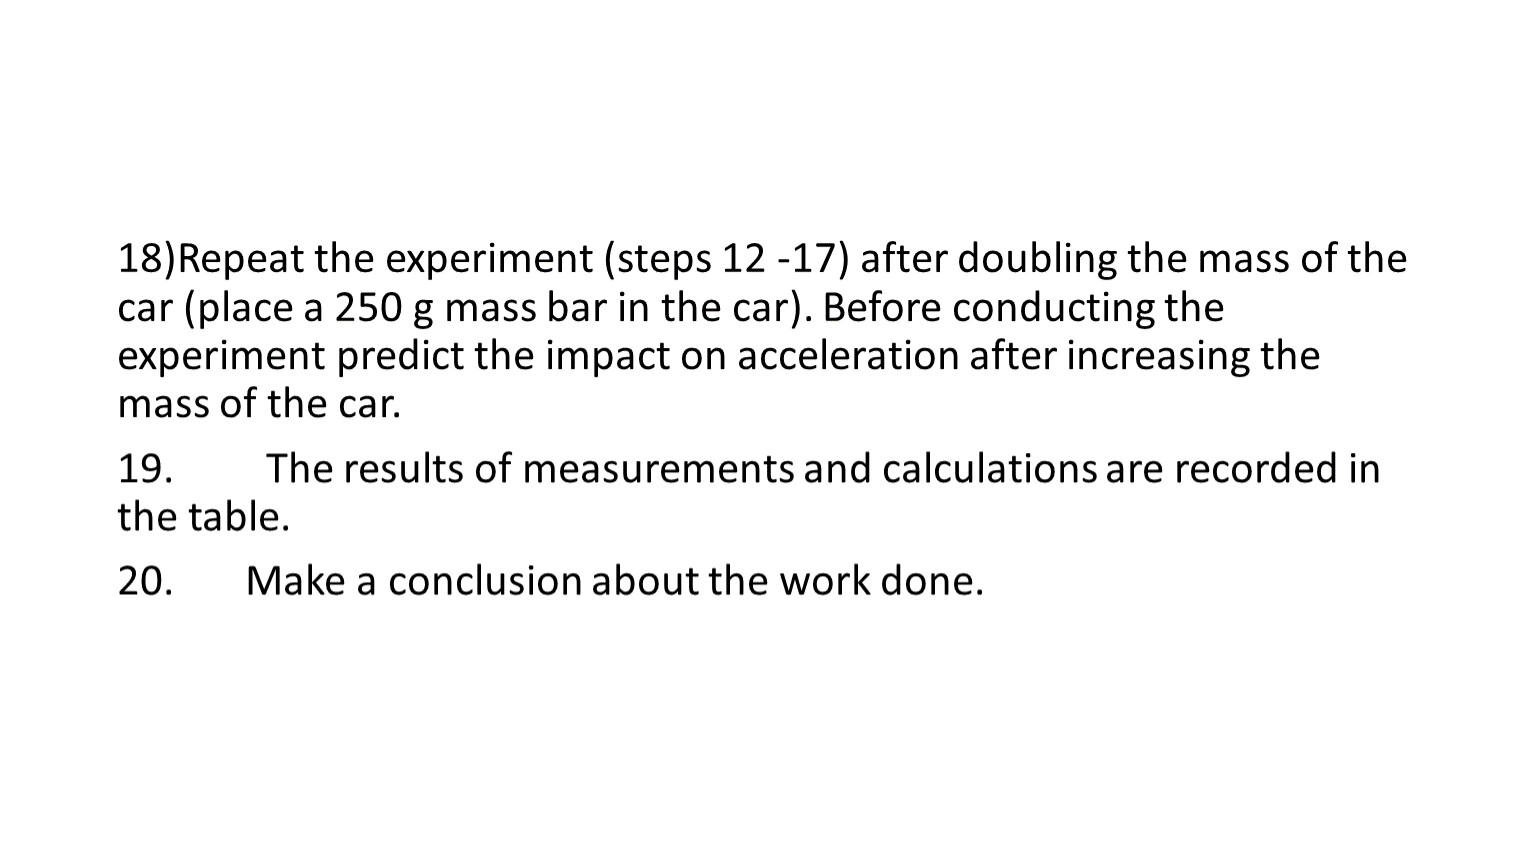
18)Repeat the experiment (steps 12 -17) after doubling the mass of the car (place a 250 g mass bar in the car). Before conducting the experiment predict the impact on acceleration after increasing the mass of the car.
19. The results of measurements and calculations are recorded in the table.
20. Make a conclusion about the work done.
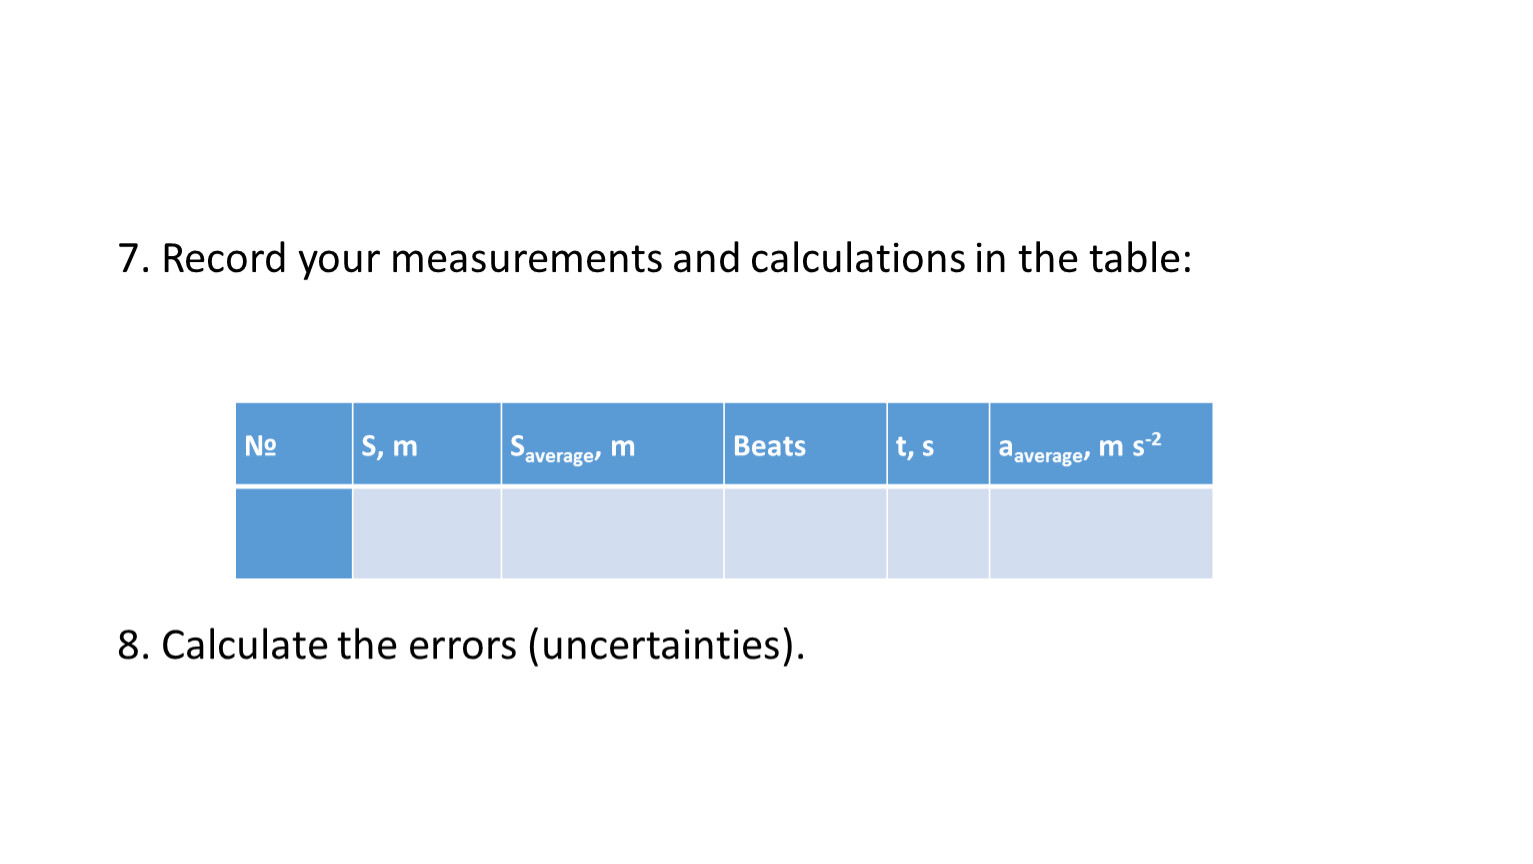
7. Record your measurements and calculations in the table:
8. Calculate the errors (uncertainties).
|
|
|
|
|
|
|
| ||||
Reflection
I think I am performing or have performed the laboratory work correctly so far
I know how to correctly finish the remaining parts of the laboratory work.
Материалы на данной страницы взяты из открытых источников либо размещены пользователем в соответствии с договором-офертой сайта. Вы можете сообщить о нарушении.